A14 - Real-life graphs
A graph can turn a rule into a useful answer, even when solving its equation is awkward. In A14 you will plot and interpret real-life graphs, follow journeys, connect speed with acceleration, and use reciprocal models. The Higher part uses exponential graphs to estimate times in a decay model.
Plotting a model and reading a solution
A tank's water depth after minutes is modelled by centimetres. About how long does it take to reach ? The formula looks awkward, but a graph makes the question a horizontal journey followed by a vertical one.
You already know
Substitute inputs to make a table of coordinates. Plot the input on the horizontal axis and the output on the vertical axis. Each axis needs a quantity, a unit and an evenly spaced scale.
Here the allowed inputs are . Negative times have no meaning in this model. A supplied model is a rule to use within its stated limits, not a promise about the tank for ever.
The rule is given in the question. You do not need to learn this particular rule. Graphs can represent unfamiliar rules just as well as familiar straight lines and quadratics.
Graphical solution
A value obtained by reading where a graph meets a required line or another graph. For example, the time when a depth reaches is the horizontal coordinate where the depth graph meets . The answer is usually approximate because of plotting and reading limits.
To plot this continuous model, work out a table and draw a smooth curve through its points. If the input counted whole people instead, only whole-number inputs would make sense: you would not invent half a person by joining the points.
Worked example 1: a water-depth model
Question. Plot for , then estimate when . Give the time to the nearest minute. Calculator allowed.
Plan. Calculate depths at whole minutes, plot the smooth curve, then read across from and down to the time axis.
| in minutes | |||||||
|---|---|---|---|---|---|---|---|
| in centimetres |
The table shows rounded plotting values. Calculate from the original rule, not from an earlier rounded depth.
Why this step? The required is a depth, so start on the vertical axis. Starting at would answer a different question.
Answer. The graph gives about minutes.
Check. The answer lies between and , where the table brackets . Substitution at gives , close to .
Change only the target depth. The curve and axes remain exactly the same.
Worked example 2: a different target on the same graph
Question. Use the same model graph to estimate when the depth reaches , to the nearest minute. Calculator allowed.
Plan. Read across from depth , meet the curve, then read down to time.
Why this step? A horizontal line fixes the depth while allowing time to vary. Its intersection picks out the required time.
Answer. About minutes.
Check. , close to the target.
[DIAGRAM: asset_name: Reading two target depths from a non-standard model; asset_slug: aqa8300_a28_water; caption: Read horizontally from the required depth, then vertically down to the time; description: A graph of h equals t plus 4t over t plus 1 from time 0 to 6 minutes and depth 0 to 10 centimetres. Blue points mark the table. Sage dashed reading lines connect depth 5 to a time near 2.2 and clay dashed lines connect depth 7 to a time near 3.8. Both axes have labelled quantities, units and regular scales.]
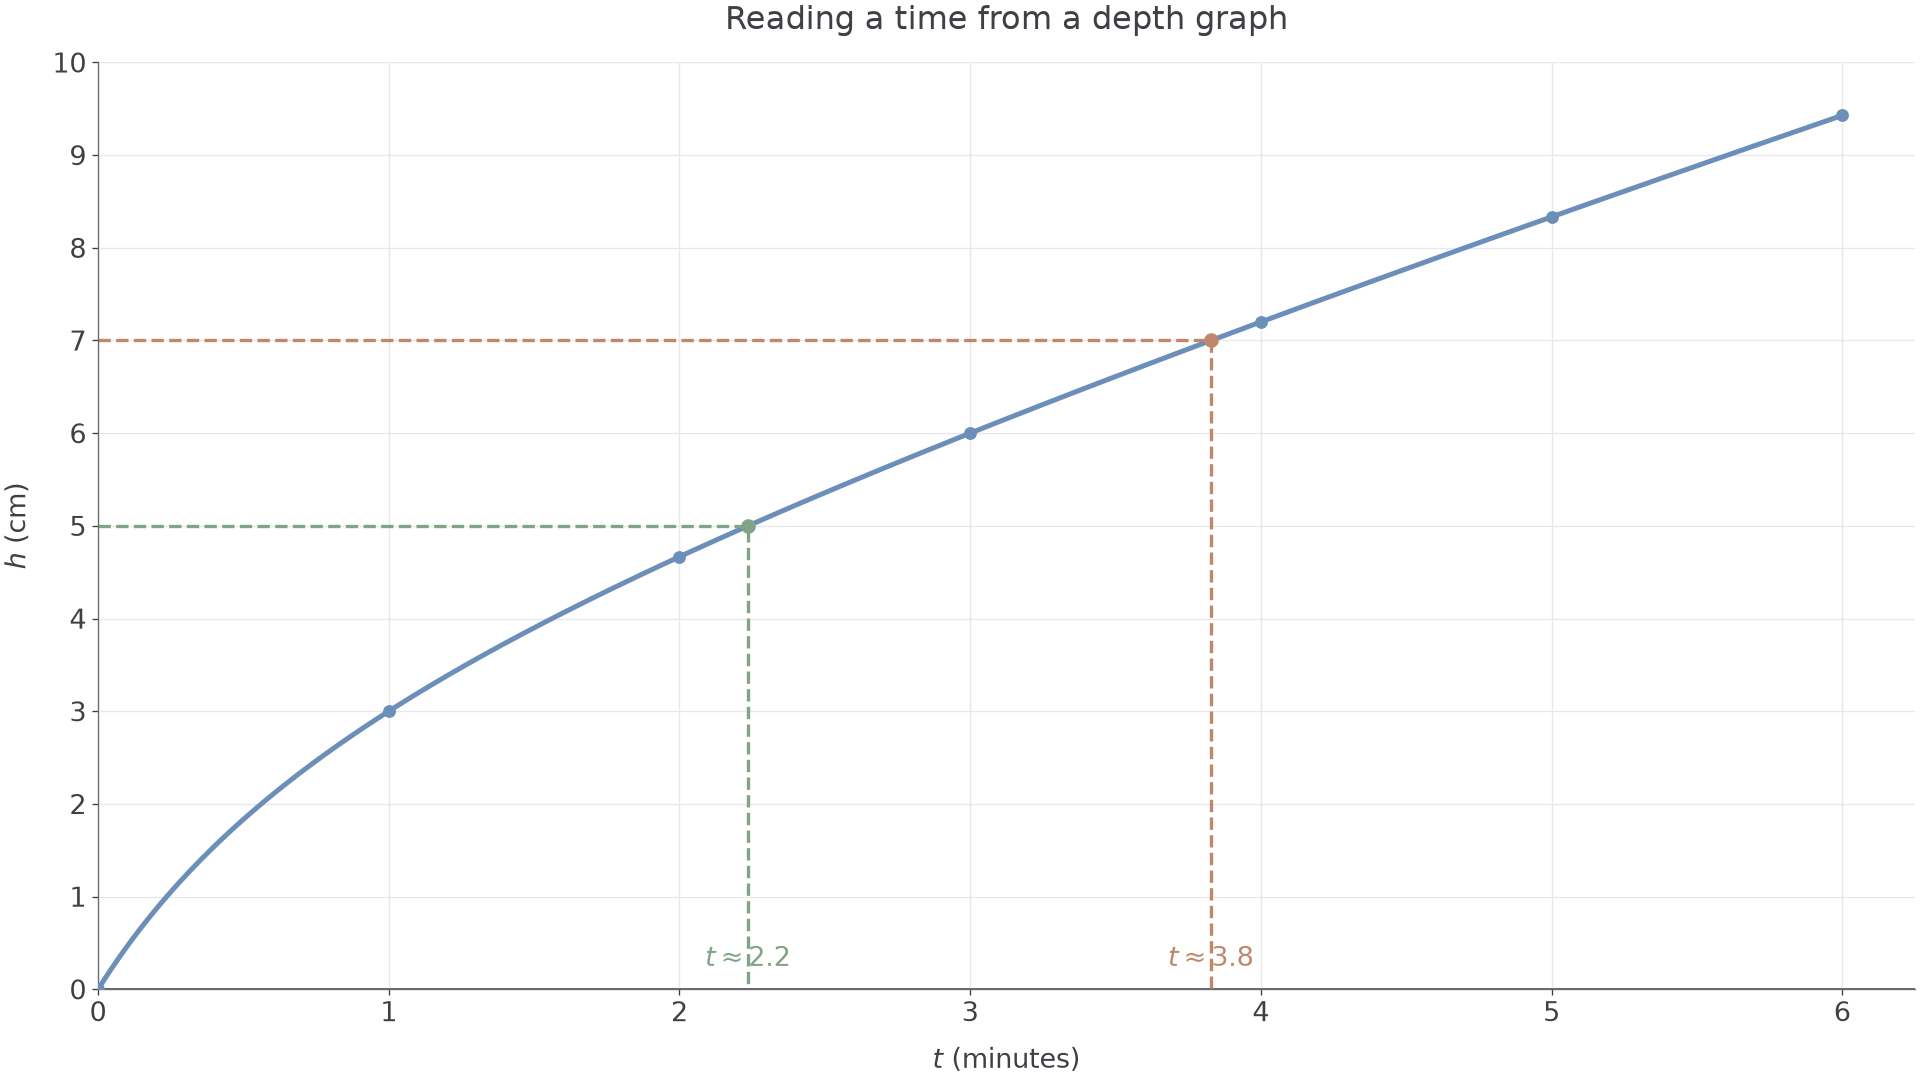
The same construction solves a comparison problem. Plot both models on the same axes. At an intersection they have the same output for the same input. If two cost graphs meet at , both cost £18 at input ; the time is , not .
Watch out
Wrong: reading when asked when . Right: distinguish “the depth after minutes” from “the time when the depth is ”. Check the axis labels before drawing reading lines.
Nearby readings also let you bracket an answer without pretending to know more precision than the information supports.
Distance-time journeys
On a distance-from-home graph, height tells you position relative to home. It does not tell you the total length of the journey so far. A falling section means returning towards home; it does not mean travelling a negative distance.
A straight rising section shows a constant outward speed. A horizontal section means the distance from home is unchanged, so the traveller is stationary. A steeper straight section means a greater speed. A curve whose slope changes represents a changing speed.
Speed on a constant-speed section
Use the distance and elapsed time for the same section. Metres divided by minutes gives ; metres divided by seconds gives .
Not on the formulae sheet: learn it.
Use the horizontal difference for time, rather than the finishing clock reading. On a return section, the distance travelled is the amount by which the distance from home falls.
Worked example 3: a walk with a stop
Question. A distance-from-home graph joins , , and with straight sections. Time is in minutes and distance in metres. Work out the stopping time and the speed on each moving section. Non-calculator.
Plan. Find the duration of each section, then divide its travelled distance by its duration.
Why this step? The return lasts minutes. Dividing by would include the outward journey and the stop.
Answer. Stationary for minutes; outward speed ; return speed .
Check. The return covers the same distance more slowly, so it takes longer: minutes instead of .
Change only the arrival time home, from minutes to . The outward journey and stop stay the same.
Worked example 4: a quicker return
Question. The final point is now . Work out the return speed and the total distance travelled. Non-calculator.
Plan. Use the new return duration, then add the outward and return distances.
Why this step? Finishing at height zero means being home. It does not erase the distance already walked.
Answer. Return speed ; total distance .
Check. The outward and return lines now have equal steepness, agreeing with their equal speeds.
[DIAGRAM: asset_name: Two distance-from-home journeys; asset_slug: aqa8300_a28_journeys; caption: A horizontal section is a stop; a steeper return means a faster walk home; description: Two labelled distance-from-home versus time graphs join 0 comma 0 to 2 comma 120 to 5 comma 120. The blue return ends at 8 comma 0 in the first panel. The clay return ends at 7 comma 0 in the second. The stop from 2 to 5 minutes is highlighted in sage and every corner has a coordinate label.]
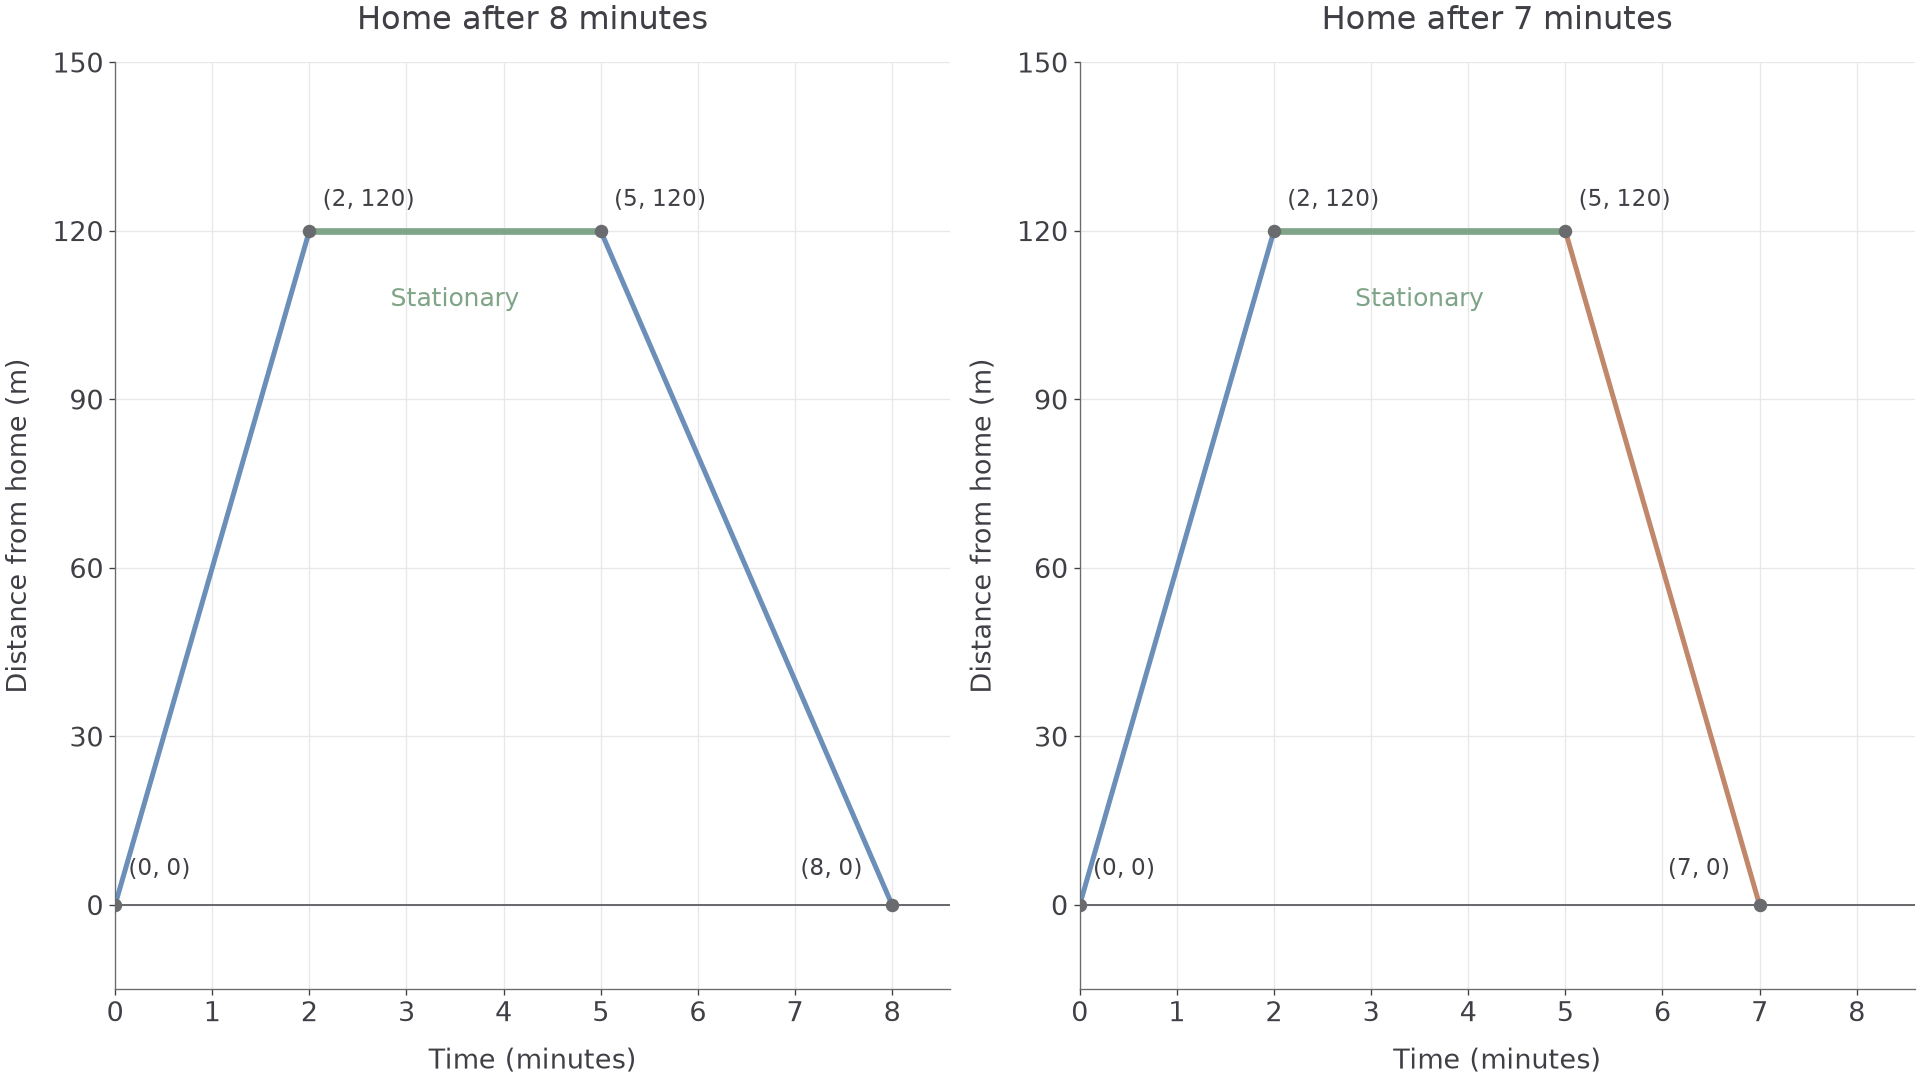
A graph of total distance travelled would stay level during a stop and rise during both moving sections. Always read the vertical axis before interpreting a fall.
Watch out
Wrong: “The return speed is .” The graph's slope is negative because the distance from home decreases, but speed is the positive rate of covering distance. Right: the return speed is .
Apply the same section-by-section reading to a new journey.
Speed and acceleration graphs
The same-looking line can mean different things on different axes. A horizontal distance-time line means stationary. A horizontal speed-time line at means moving steadily at . Its height is speed, not distance.
On a speed-time graph, a rising line means speeding up and a falling line means slowing down. A straight sloping section means speed changes by the same amount each second. Its acceleration is constant. A curved speed-time section has changing acceleration.
Acceleration
The change in velocity per unit time. For motion in one fixed direction, an increasing speed gives positive acceleration and a decreasing speed gives negative acceleration. A change of each second is . Constant speed in that direction gives zero acceleration.
Velocity records direction as well as speed. In the examples below the motion remains in the positive direction, so speed and the numerical value of velocity agree.
Constant acceleration
This gives the acceleration on a straight velocity-time section. Use seconds with to obtain .
Not on the formulae sheet: learn it.
On an acceleration-time graph, the height is already acceleration. A horizontal line above zero means velocity increases steadily, not that velocity is constant. A line on the time axis means zero acceleration.
Continue this lesson.
You’re previewing NovaLearn without an account. Create a free account to read the rest.
Create free account