A15, R15 - Gradients and areas under graphs (Higher)
A curve records more than its plotted heights. In A15 you will calculate or estimate gradients and areas, and interpret them in journeys and financial models. R15 connects a chord's gradient to an average rate and a tangent's gradient to the rate at one instant.
Average rates and chords (Higher)
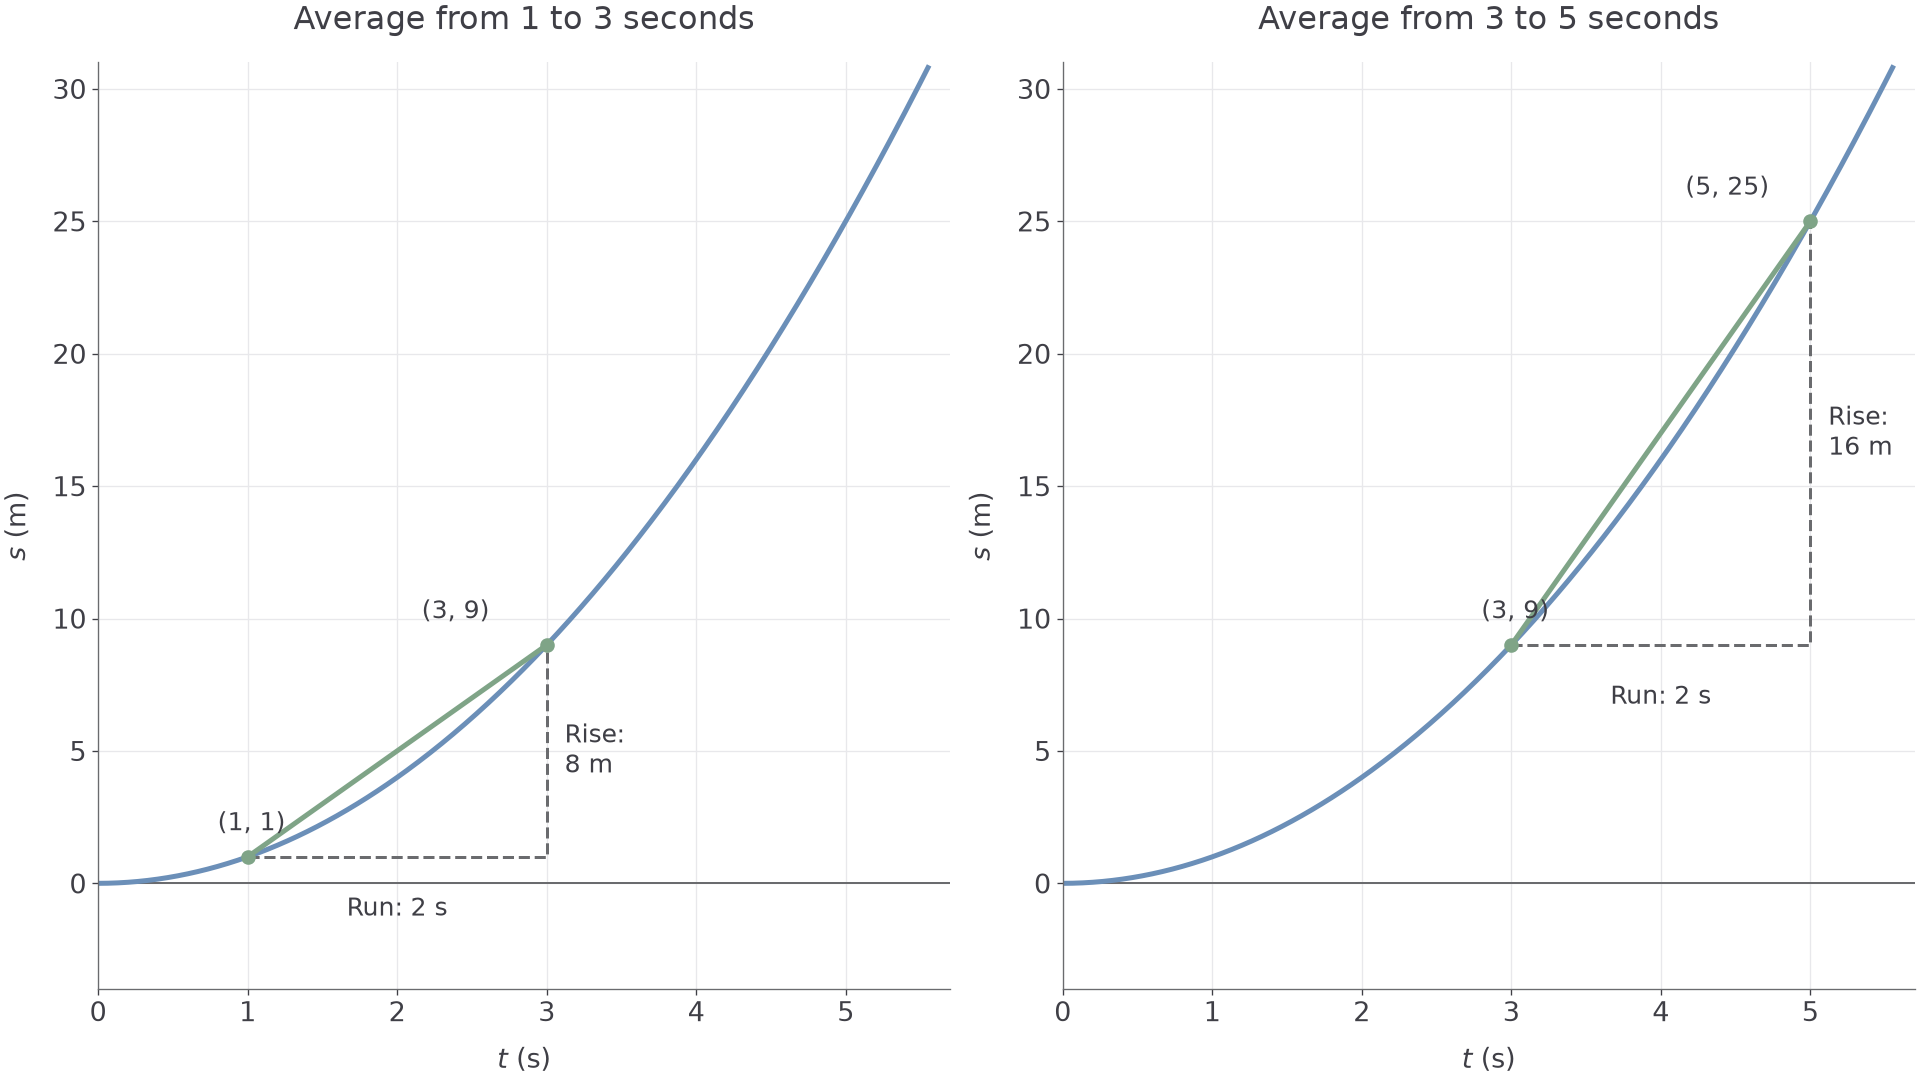
A distance-time curve follows , with distance in metres and time in seconds. Between and seconds its average speed is , yet at seconds its speed is . Can both be correct? We need to separate a rate over an interval from a rate at one instant.
You already know
A straight line's gradient is vertical change divided by horizontal change. Speed is distance divided by time. Substituting into a function gives coordinates on its graph.
At , ; at , . The object covers metres in those seconds. Joining the endpoints with a straight line shows the steady rate that would produce the same overall change.
Chord and average rate of change
A chord is a straight line segment joining two points on a curve. Its gradient is the average rate of change of the vertical quantity over that input interval. The endpoints, rather than the curve's changing steepness between them, determine this average.
A distance-time curve may have changing speed throughout the interval. Its chord still gives a single average. On a balance-time graph, the same calculation gives average change in money per unit time.
Average rate from two points
For endpoints and , with ,
Use final minus initial in both differences. The units are vertical-axis units divided by horizontal-axis units.
Not on the formulae sheet: learn it.
You can obtain the endpoints from a graph, a table or an algebraic rule. The rate calculation is the same in all three forms. The particular model is given in the question; it is not a formula to memorise.
Worked example 1: the first interval
Question. For , work out the average speed between and . Non-calculator.
Plan. Calculate the two distances, then divide the distance change by the elapsed time.
Why this step? The question starts at , so neither the distance nor the time should be measured from zero.
Answer. , the gradient of the chord joining to .
Check. A steady speed of for seconds would cover the required metres.
Move only the interval later, keeping its duration at seconds. The curve is steeper there.
Worked example 2: a later interval
Question. For the same model, work out the average speed between and . Non-calculator.
Plan. Use the two new endpoints of the interval.
Why this step? An average depends on the chosen interval. A curve does not have one gradient that describes its whole length.
Answer. .
Check. This later chord is steeper than the first. Its average speed is greater, matching the increasing steepness of the distance-time curve.
[DIAGRAM: asset_name: Chords show average rates over different intervals; asset_slug: aqa8300_r09_chords; caption: Each chord represents the total change divided by the interval length; description: Two distance-time panels show the same blue quadratic s equals t squared. The first has a sage chord from 1 comma 1 to 3 comma 9, with a dashed right-angled triangle labelled rise 8 metres and run 2 seconds. The second has a sage chord from 3 comma 9 to 5 comma 25, with rise 16 metres and run 2 seconds.]
If the table instead records a balance of £70 on day and £58 on day , the average change is pounds per day. The negative sign means the balance falls, not that “negative days” have passed.
Watch out
Wrong: using for the average between and . That describes the interval from zero instead. Right: subtract both starting values, giving .
Choose the correct endpoints for another interval on the same kind of model.
Instantaneous rates and tangents (Higher)
For a rate at one instant, look at the curve's direction at that point. A long chord averages over changing directions. A tangent follows the local direction instead.
Tangent and instantaneous rate
A tangent is a straight line through a point on a smooth curve with the same local direction as the curve there. Its gradient gives the instantaneous rate of change at that input. On a distance-time graph it gives speed at that instant; on a velocity-time graph it gives acceleration.
To draw one, place a ruler through the required point and turn it until the line matches the curve's local direction. Extend it well either side. A tangent may cross a curve elsewhere; “touches the whole graph exactly once” is not a general definition.
Choose two widely separated, readable points on the tangent line. They do not both need to lie on the curve. Use a large right-angled gradient triangle to reduce the effect of reading errors.
Estimating a rate at one point
The estimate depends on drawing and reading the tangent accurately. A horizontal tangent gives rate zero.
Not on the formulae sheet: learn it.
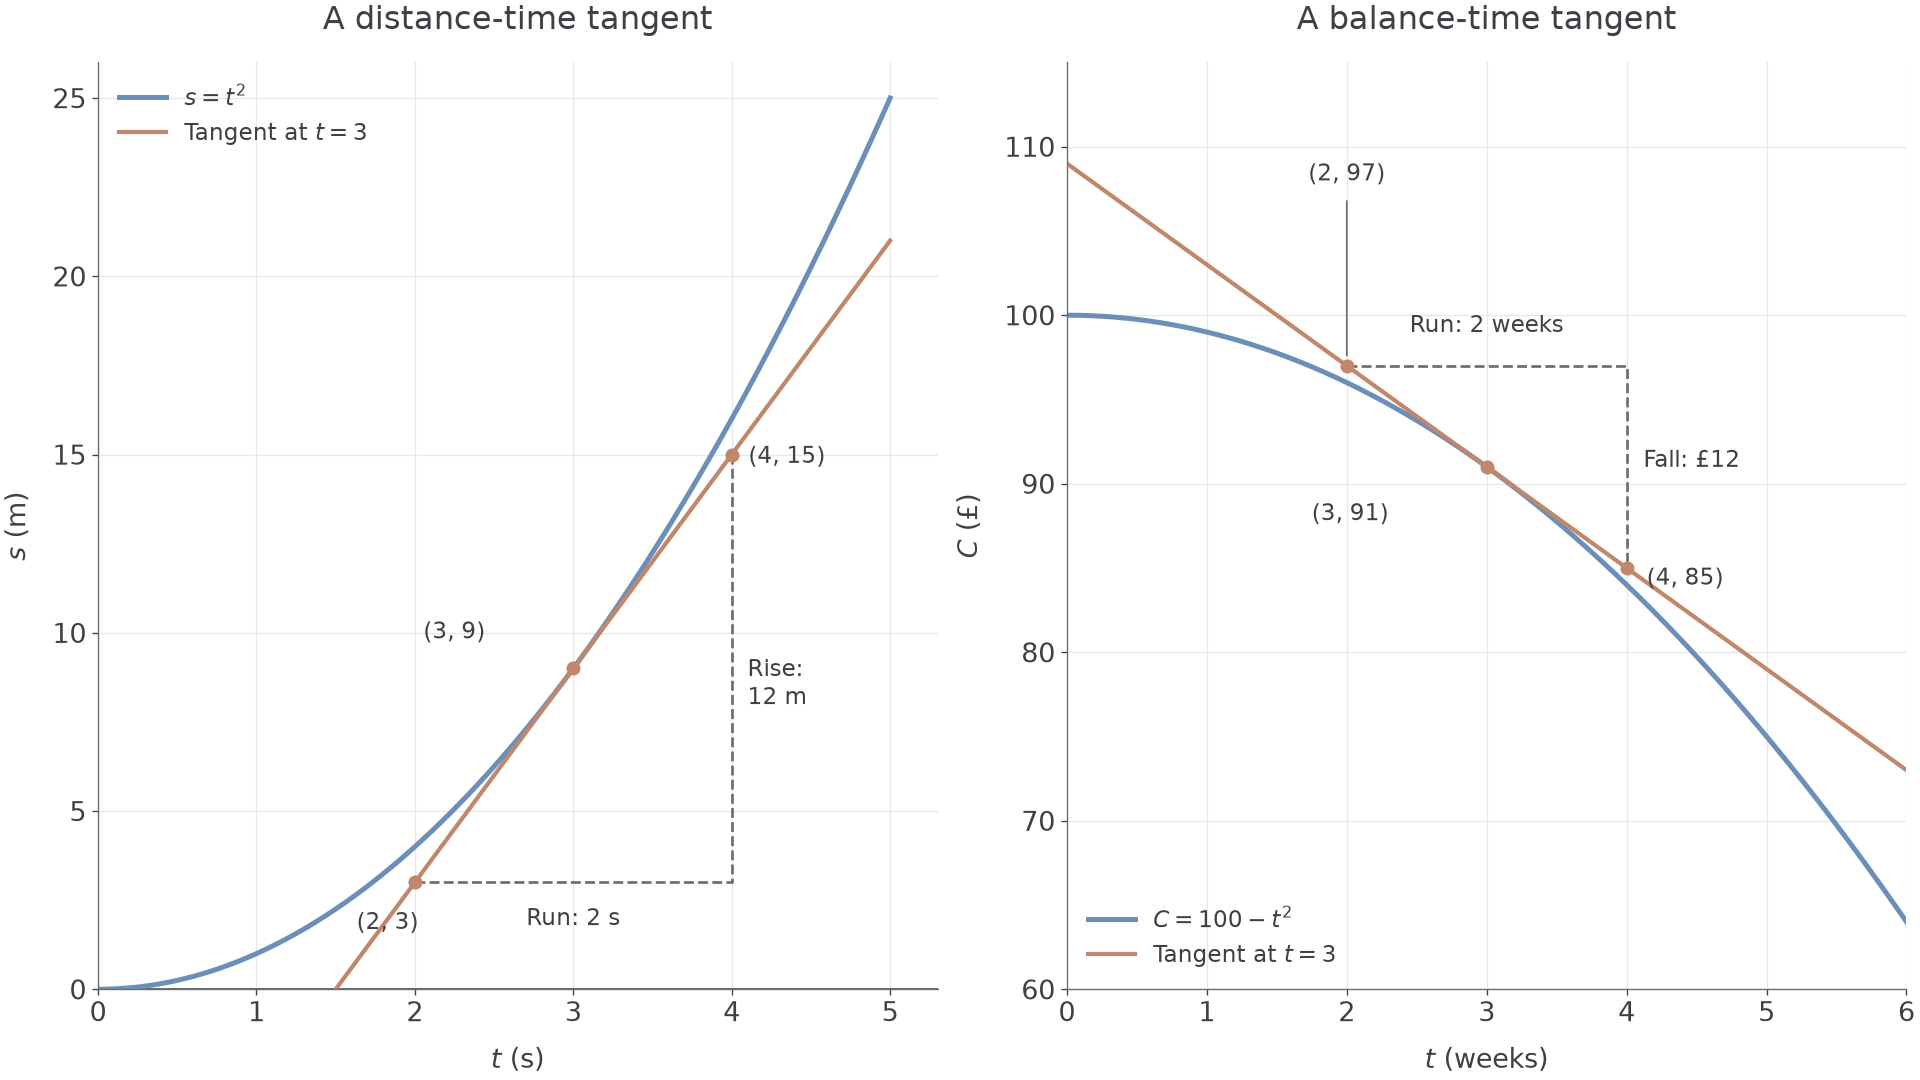
The first tangent below is drawn at on . The marked triangle uses and , points on the tangent, not points on the curve.
[DIAGRAM: asset_name: Tangent gradients for distance and money; asset_slug: aqa8300_r09_tangents; caption: Read two points on the tangent to estimate the rate at the marked point; description: The left panel shows s equals t squared, its tangent s equals 6t minus 9 at 3 comma 9, and tangent points 2 comma 3 and 4 comma 15. A dashed gradient triangle shows rise 12 and run 2. The right panel shows C equals 100 minus t squared, its tangent C equals 109 minus 6t at 3 comma 91, and tangent points 2 comma 97 and 4 comma 85, with a fall of 12 and run of 2.]
Worked example 3: speed at an instant
Question. A tangent to at passes through and . Estimate the speed at , with time in seconds and distance in metres. Non-calculator.
Plan. Use the tangent's two marked points to find its gradient.
Why this step? Using two points on the curve would give a chord and an average rate over an interval, rather than the rate at .
Answer. Approximately .
Check. The nearby chord from to has gradient , agreeing with the tangent.
Now use a falling graph. Only the sign of the local rate changes in the calculation; financial axes give the result a different meaning.
Worked example 4: a falling balance
Question. A balance-time curve is , with in pounds and in weeks. A tangent at passes through and . Estimate the instantaneous rate and interpret it. Non-calculator.
Plan. Calculate the signed tangent gradient, then attach the units from the axes.
Why this step? Keep the negative sign: the balance decreases as time increases. The units are pounds per week, rather than pounds alone.
Answer. Approximately pounds per week. At that instant, the balance is falling at about £6 per week.
Check. The tangent's midpoint is , and , so the line passes through the required point.
The opening speeds are both correct. The average describes to seconds; describes just the instant at seconds. Here is a neat coincidence for this quadratic: the chord from to has gradient , equal to the tangent gradient at the midpoint time . Different questions can share an answer without meaning the same thing.
Watch out
Wrong: using and simply because they lie on . Those points define a chord. Right: draw the tangent at the stated time first, then use points on that line. When asked to show working, leave the tangent and gradient triangle visible.
Apply the same signed calculation to a new financial tangent.
Areas under straight sections (Higher)
Travelling at for seconds covers metres. On a speed-time graph that is a rectangle with height and width . Its area has the right units too: .
You already know
Rectangle area is width times height; triangle area is half base times perpendicular height. These two area rules are not on the formulae sheet: learn them. A straight sloping graph section encloses a triangle or trapezium with the time axis.
Continue this lesson.
You’re previewing NovaLearn without an account. Create a free account to read the rest.
Create free account