P1–P5 - Probability, relative frequency and expected outcomes
A probability describes a chance, not a promise. P1 and P2 connect experiments, fairness and expected outcomes; P3 and P4 connect the probability scale with complete sets of outcomes. P5 explains why a larger, unbiased experiment usually gives a more reliable estimate.
Chance on a scale
If you toss a fair coin times, must you get exactly heads? Keep that question in mind: “fair” tells us something precise, but it does not organise the results for us.
A single toss is a trial. Its outcome might be heads. An event is a description of the result we are interested in: for example, “heads” on one toss, or “an even number” on a die. An event may contain several outcomes.
Probability
A number describing how likely an event is, from for impossible to for certain. An even chance has probability . Write probabilities as fractions, decimals or percentages, never as ratios.
On an ordinary fair six-sided die, rolling is impossible, rolling is unlikely, rolling an even number has an even chance, rolling below is likely, and rolling below is certain. These probabilities are , , , and , respectively.
| Probability | |||||
|---|---|---|---|---|---|
| Description | Impossible | Unlikely | Even chance | Likely | Certain |
“Likely” does not mean certain. A probability of still leaves a chance of that the event does not happen. Values such as and cannot be probabilities. The scale and these meanings are not on the formulae sheet: learn them.
Key idea
A probability describes how strongly the outcomes favour an event. It does not tell you which outcome will happen next.
Use both ends of the scale when judging a claim. A large chance can still fail; a small chance can still happen.
Fairness and equally likely outcomes
Counting works only when the outcomes you count really have the same chance.
You already know
Equivalent fractions, decimals and percentages describe the same proportion. For example, . Cancel a common factor to simplify a fraction.
A fair die gives each face the same chance. A fair spinner with equal sectors gives each sector the same chance. A random selection gives each individual object an equal chance if the objects are thoroughly mixed and the selection method does not favour one of them. The colours need not have equal chances: a bag may contain more red counters than blue counters.
Probability from equally likely outcomes
Use this only when the counted individual outcomes are equally likely and the list is complete. means “the probability of event ”.
Not on the formulae sheet: learn it.
For a bag, count counters rather than colour names. For a spinner, count equal sectors rather than different labels.
Worked example 1: one winning face
Question. An ordinary fair six-sided die is rolled. Work out the probability of rolling . Non-calculator.
Plan. Count the winning face and divide by the number of equally likely faces.
Why this choice? The die is fair, so counting faces gives their relative chances.
Answer. .
Check. Six single-face probabilities of make .
The next example changes only the event. An event can include more than one winning face without changing the denominator.
Worked example 2: several winning faces
Question. An ordinary fair six-sided die is rolled. Work out the probability of a number greater than . Non-calculator.
Plan. List the faces satisfying the condition, then use the same six-face total.
Why list first? The wording “greater than” excludes , so the boundary matters.
Answer. .
Check. The four other faces have probability ; together the probabilities make .
An unfair die may give different probabilities to different faces. The same count would then be unjustified, even though the labels still run from to .
Watch out
Wrong: “There are two colours, so each has probability .” A bag with red counters and blue counters has , if each counter is equally likely to be chosen.
The next event changes the boundary again. Include the endpoint this time.
Tables and frequency trees
An experiment gives observed counts, which may differ from the counts a fair model would predict.
Record one tally for each trial, then total the tallies to obtain a frequency. Use categories that do not overlap and include every result. If a die lands on an edge, decide before starting whether to repeat that trial; do not quietly remove awkward results afterwards.
Frequency
The number of times an outcome or event occurs. A frequency is a count, not a probability. For example, heads in tosses has frequency , not probability .
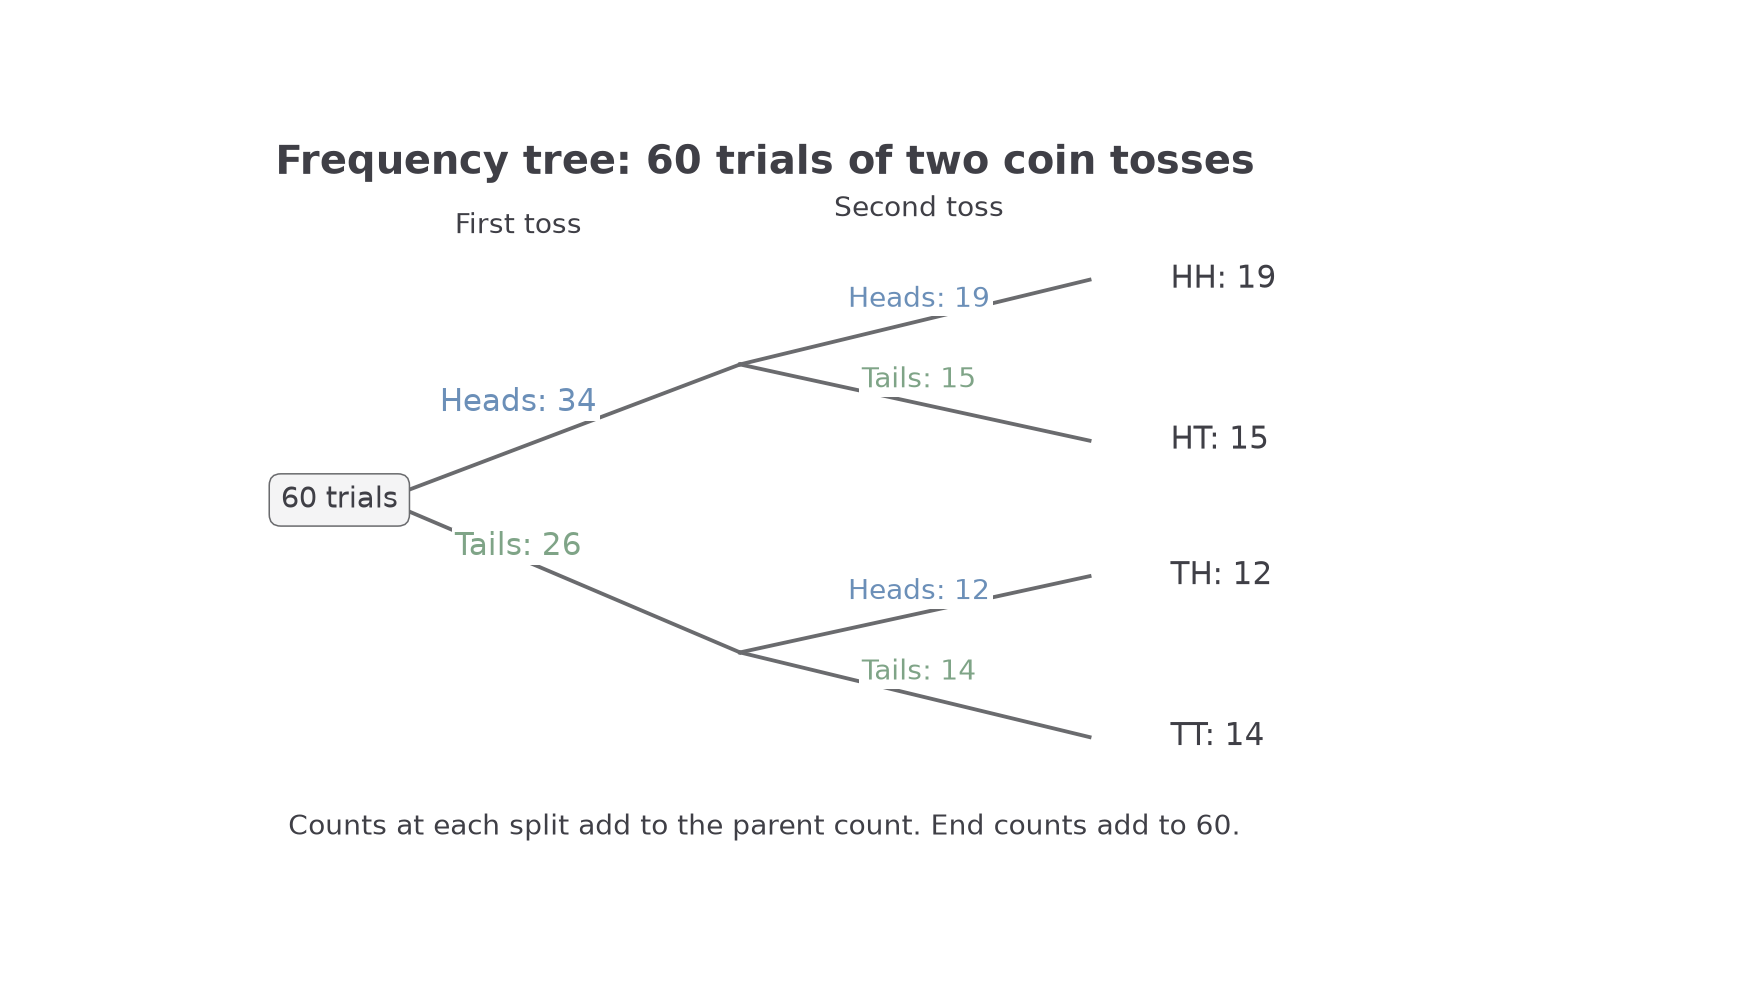
A table keeps one classification together. A frequency tree splits the same total into smaller groups. Its branches carry counts, and the child counts must add to their parent count.
Worked example 3: a missing frequency
Question. A die is rolled times. Complete the missing frequency. Non-calculator.
| Face | ||||||
|---|---|---|---|---|---|---|
| Frequency | ? |
Plan. Subtract the total recorded for the first five faces from the total number of rolls.
Why subtract from ? Every roll belongs to exactly one face category.
Answer. The missing frequency is .
Check. . Unequal frequencies do not by themselves prove that the die is unfair.
The next example changes the display from a table to a tree. Counts still have to balance at every split.
[DIAGRAM: asset_name: Frequency tree for two coin tosses; asset_slug: aqa8300_p01_frequency_tree; caption: Every split divides a count into two groups that add back to the parent; description: A frequency tree starts with 60 trials of two coin tosses. First toss heads has count 34 and tails has count 26. Heads splits into second-toss heads 19 and tails 15. Tails splits into second-toss heads 12 and tails 14. All labels are frequencies, not branch probabilities.]
Worked example 4: analysing a frequency tree
Question. In trials, a coin is tossed twice. The first toss is heads in trials. Of these, also have heads second. Of the first-toss tails trials, have heads second. Work out the frequency of exactly one head. Non-calculator.
Plan. Complete the two mixed-result groups, then add them.
Why two groups? “Exactly one head” includes heads then tails and tails then heads, but excludes two heads.
Answer. trials.
Check. The four end counts add to .
Frequency trees and probability trees look alike. Their labels mean different things: the counts in this tree are not fractions that should add to .
Watch out
Wrong: add a parent count to its children to obtain the total. That counts the same trials twice. Right: add the end groups, or use the starting total once.
Balance each split before combining end groups in the next question.
Probabilities that make one whole
If every possible outcome has been included exactly once, its probability must have been included exactly once too.
Continue this lesson.
You’re previewing NovaLearn without an account. Create a free account to read the rest.
Create free account