P6, P7 - Sample spaces and Venn diagrams
A good picture makes it hard to miss an outcome or count it twice. P6 teaches you to organise sets using tables, grids, Venn diagrams and listing trees. P7 uses complete possibility spaces to turn equally likely outcomes into probabilities.
Possibility spaces for one experiment
Two fair dice can make different totals, from to . Does that make every total equally likely? By the end of the lesson, a complete possibility space will explain why is six times as likely as .
You already know
List outcomes systematically, so each appears once. For equally likely outcomes, probability is winning outcomes divided by all outcomes. An event can contain several outcomes.
Begin with one experiment. A possibility space, also called a sample space, is a complete list of its possible outcomes. For a die, is complete. The list is not. The list describes two events rather than six individual faces, but it is another complete way to classify a roll.
Set notation
A set is a collection of distinct members. Curly brackets list the members: . Writing a member twice does not create another member. If physical objects carry repeated labels, distinguish the objects before counting equally likely outcomes.
For example, two tickets both labelled are two objects, even though their printed number is the same. Their chances contribute to the same event “number ”. These listing rules are not on the formulae sheet: learn them.
Worked example 1: four distinct labels
Question. A fair spinner has four equal sectors, labelled . Write down its possibility space and work out . Non-calculator.
Plan. List all four equally likely sectors, then count those labelled .
Why use sectors? Equal sectors are the equally likely physical outcomes.
Answer. and .
Check. Four probabilities of add to .
The next example changes only the labels: one label is repeated. Keep the equal sectors separate when counting.
Worked example 2: a repeated label
Question. A fair spinner has four equal sectors, labelled . Work out . Non-calculator.
Plan. Name the sectors , then identify the two whose printed label is .
Why not use ? The three different number labels are not equally likely: occupies twice as much of the spinner as either other label.
Answer. .
Check. .
A sample space is useful only if you know what each entry represents. State whether you are listing objects, faces, labels or totals.
Watch out
Wrong: “There are three different labels, so each has chance .” Right: first check that the listed outcomes have equal chances. Repeated labels can hide several equally likely sectors.
Try another repeated label, with the number of equal sectors changed.
Grids for combined experiments
For two experiments, a row and a column can identify each complete outcome exactly once.
Use one die for the rows and the other for the columns. The cell in row , column represents . Its total is . The cell is a different outcome with the same total.
[DIAGRAM: asset_name: Two-dice possibility grid; asset_slug: aqa8300_p02_grid; caption: Six of the 36 equally likely ordered dice outcomes have total 7; description: A six-by-six grid has first die values 1 to 6 down the rows and second die values 1 to 6 across the columns. Every cell gives the sum of its row and column values. The six cells summing to 7 are shaded pale blue.]
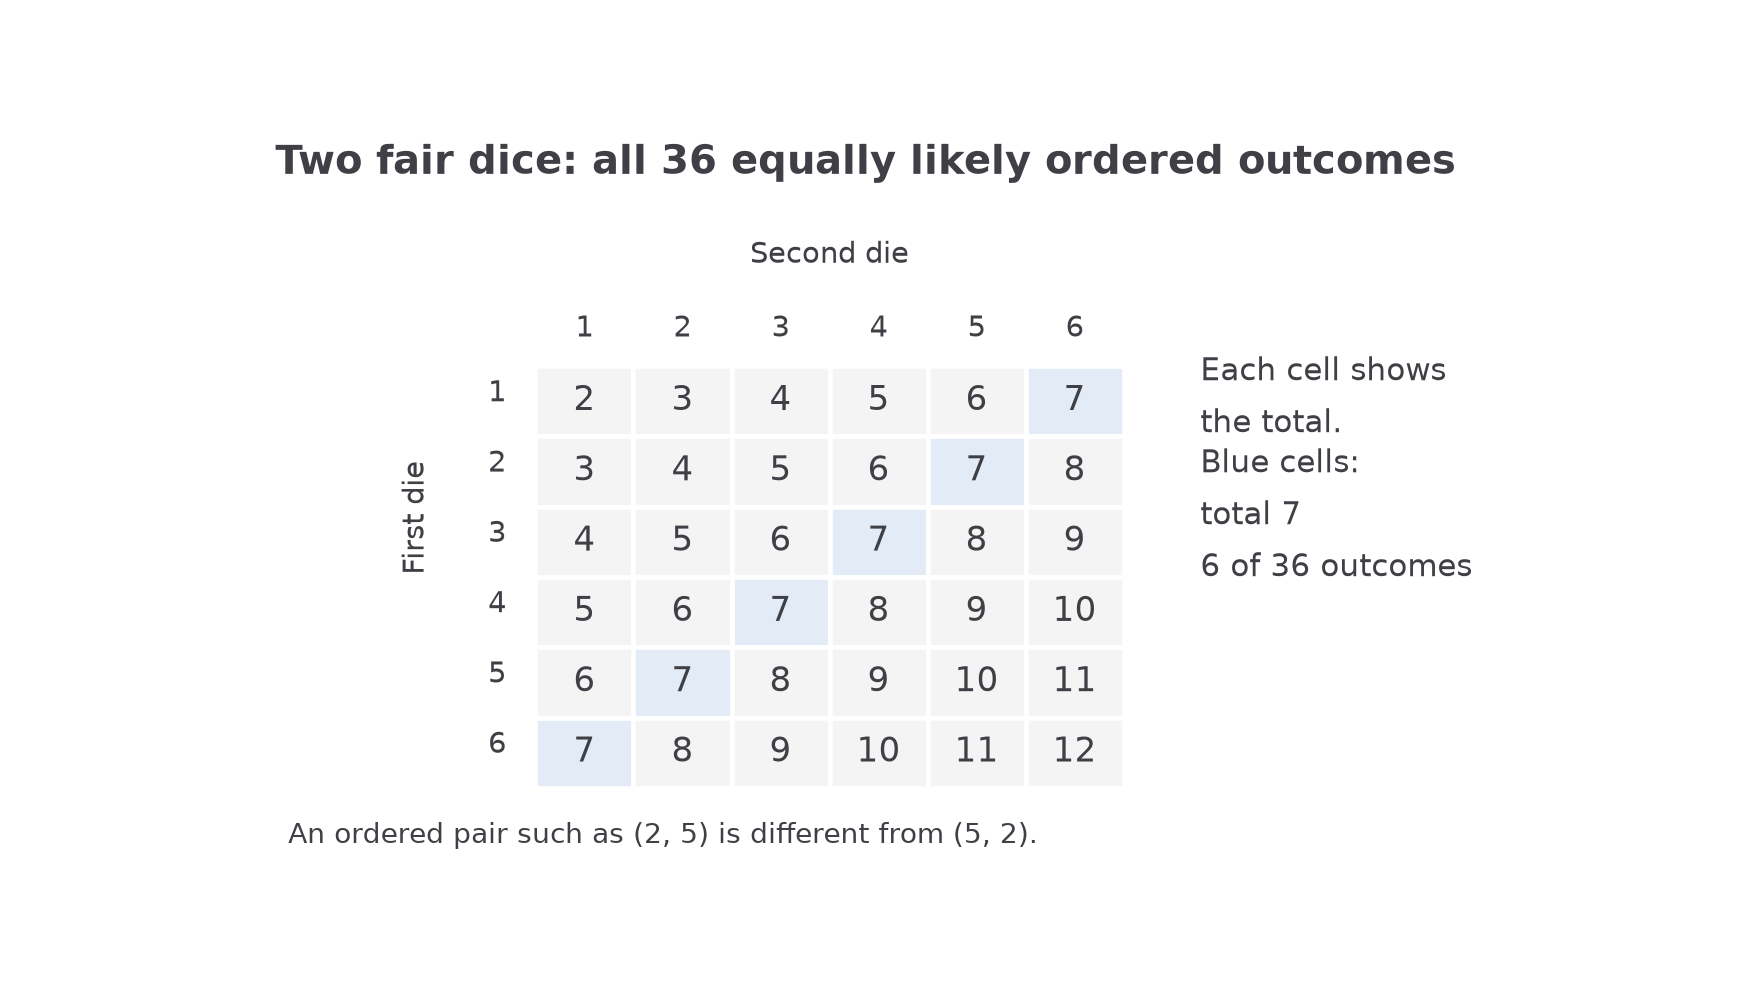
The grid contains cells. For two fair dice rolled independently, each cell has the same chance. If one die is biased, or the second result is controlled by the first, a complete grid can still list the outcomes, but the cells need not be equally likely.
An ordered outcome
A complete result that records which experiment produced each value. For two dice, and are distinct ordered outcomes even though both have total .
The cell-counting rule is the equally likely outcomes rule from the previous lesson; it is not on the formulae sheet. Count a complete set of cells before simplifying the fraction.
Worked example 3: a total of seven
Question. Two ordinary fair six-sided dice are rolled independently. Work out the probability of a total of . Non-calculator.
Plan. List the ordered pairs with total , then divide their count by the cells.
Why keep the order? A first-die and second-die is a different result from a first-die and second-die .
Answer. .
Check. There is exactly one winning cell in each of the six rows.
The next example changes only the required total. The grid stays the same, but the winning diagonal becomes shorter.
Worked example 4: a total of eight
Question. Two ordinary fair six-sided dice are rolled independently. Work out the probability of a total of . Non-calculator.
Plan. Search each row for a second value that makes .
Why is there no pair starting with ? It would need a on the second die.
Answer. .
Check. The reversed pairs are both present, and appears once.
This resolves the opening puzzle: total has only , whereas total has six cells. Eleven possible totals do not mean eleven equally likely outcomes.
Watch out
Wrong: , counting totals as equal. Right: , counting equally likely ordered pairs.
Move the target diagonal once more in this question.
Two-way tables
A two-way table classifies each person or object in two different ways.
Rows might show whether a pupil cycles; columns might show the pupil's school. Each pupil goes in one interior cell. Row totals and column totals are two ways of counting the same pupils, so their grand totals must agree.
Two-way table
A table whose rows describe one classification and whose columns describe another. A cell records the overlap of its row and column descriptions. Totals are summaries, not extra people.
To choose a pupil at random from the whole group, use the grand total as the probability denominator. “School A and cycles” names one cell; “cycles” names a whole row. This counting method is not on the formulae sheet: learn it.
Worked example 5: completing a table
Question. The table describes pupils. Complete the missing entries and work out the probability that a pupil chosen at random is from school A and cycles. Non-calculator.
| School A | School B | Total | |
|---|---|---|---|
| Cycles | |||
| Does not cycle | ? | ||
| Total | ? |
Plan. Balance the second row, then the first column; use the relevant cell over .
Why use , not ? The pupil is chosen from all pupils, not just school A.
Answer. Missing counts and ; probability .
Check. Column totals , matching the row totals .
The next example keeps the completed table and changes only the requested cell.
Worked example 6: choosing another cell
Question. In a group of pupils, are from school B and cycle. A pupil is chosen at random from the whole group. Work out the probability that the pupil is from school B and cycles. Non-calculator.
Plan. Use the count in the school-B/cycles cell over the grand total.
Why not multiply the row and column totals? Those totals overlap; the actual cell already gives the number satisfying both conditions.
Answer. .
Check. The two cycling-school probabilities add to , the probability of cycling.
Continue this lesson.
You’re previewing NovaLearn without an account. Create a free account to read the rest.
Create free account