A11, A12 - Quadratic graphs, roots and turning points
Quadratic graphs curve, turn, and often cross the horizontal axis twice. You will recognise and sketch their shapes in A12, and use roots, intercepts, symmetry and turning points to describe them in A11. Factorised algebra gives exact axis crossings that a drawing can only estimate.
Recognising and plotting quadratic graphs
A quadratic curve crosses the -axis at and . Can you locate its turning point's horizontal position without plotting another point? Keep that question: the curve's symmetry will do the work.
You already know
Coordinates are written . Substitute -values to make a graph table, and put negative inputs in brackets before squaring. Factorising reverses expanding brackets.
Compare the points of with . Increasing by always increases by , giving a straight line. For , the heights have increases , so the steepness changes. The odd-number jumps are no coincidence: . The shape itself records a number pattern.
For a linear sketch, two axis crossings are enough: meets the axes at and . Mark them and draw a straight line through them; the graph rises units per unit right and never turns. A quadratic needs a different shape, including the bend between its points.
Quadratic function
A function of the form , where . Its graph is a parabola: a smooth curve with one turning point and a vertical line of symmetry. For example, is quadratic; is linear, because it has no squared term.
If , the curve opens upwards and has a minimum. If , it opens downwards and has a maximum. Join plotted points with a smooth curve, not ruled segments. These shape facts are not on the formulae sheet: learn them.
Worked example 1: an upward-opening curve
Question. Complete a table for at . Describe the shape. Non-calculator.
Plan. Square each input, subtract , then use the equal heights on either side of zero.
The positive inputs have the same squares as their negative partners.
Why this step? Squaring opposite numbers gives the same result, explaining the paired heights.
Answer. A smooth upward-opening parabola with its lowest point at .
Check. cannot be negative, so cannot be below .
Change only the coefficient of from to . The outer minus acts after squaring.
Worked example 2: a downward-opening curve
Question. Complete the same table for . Describe the shape. Non-calculator.
Plan. Square the input, negate that square, then subtract .
Why this step? means the negative of , whereas would square the negative input and stay non-negative.
Answer. A smooth downward-opening parabola with its highest point at .
Check. , so the graph can never rise above .
[DIAGRAM: asset_name: Upward and downward quadratic shapes; asset_slug: aqa8300_a20_shapes; caption: The sign of the squared term decides whether the turning point is a minimum or a maximum; description: Two coordinate panels showing y equals x squared minus 4 and y equals minus x squared minus 4 with the seven tabulated points. Both turning points are labelled 0 comma minus 4. The left curve crosses at minus 2 and 2, while the right curve is entirely below the x-axis.]
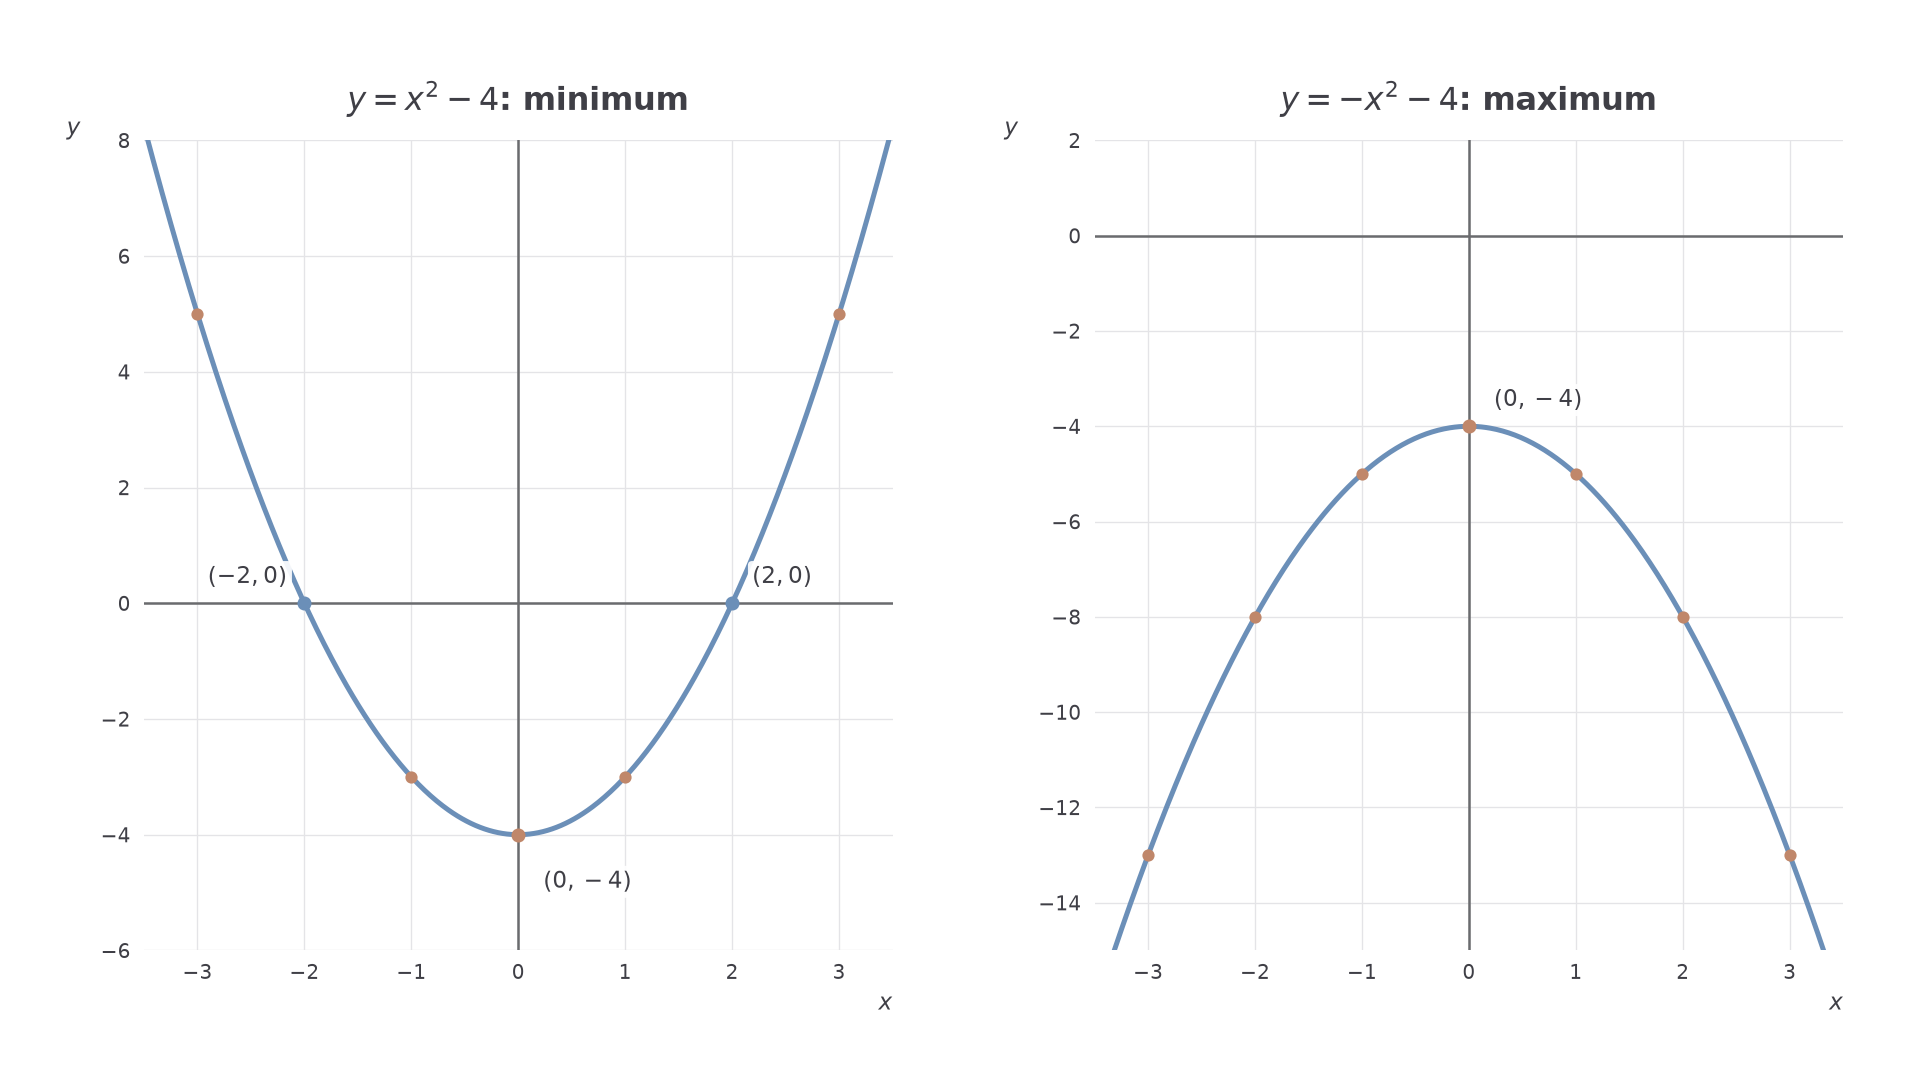
A graph table is a guide to a smooth shape. More points near the turn help you draw the bend accurately.
Watch out
Wrong: joining quadratic points with straight segments. Right: draw one smooth curve through the points. Check negative inputs carefully: , but .
Use the same negative squared-term idea with a new constant.
Roots, intercepts, turning points and symmetry
Axis crossings and the turning point give a short description of a whole curve. A root is a number; the corresponding intercept is a point. Keep those answer forms distinct.
Roots and turning point
A root of a function is an -value where . It gives an -intercept . The turning point is where the parabola changes between falling and rising; it is a minimum for an upward-opening curve and a maximum for a downward-opening curve. The axis of symmetry is the vertical line through that point.
A quadratic's two arms match on opposite sides of its symmetry line. Two points at the same height are equally far from it. In particular, two distinct roots lie equal distances either side of the turn.
Symmetry from two roots
If a quadratic has two distinct real roots and , its symmetry line is
This gives the turning point's -coordinate. Read or work out the height separately.
Not on the formulae sheet: learn it.
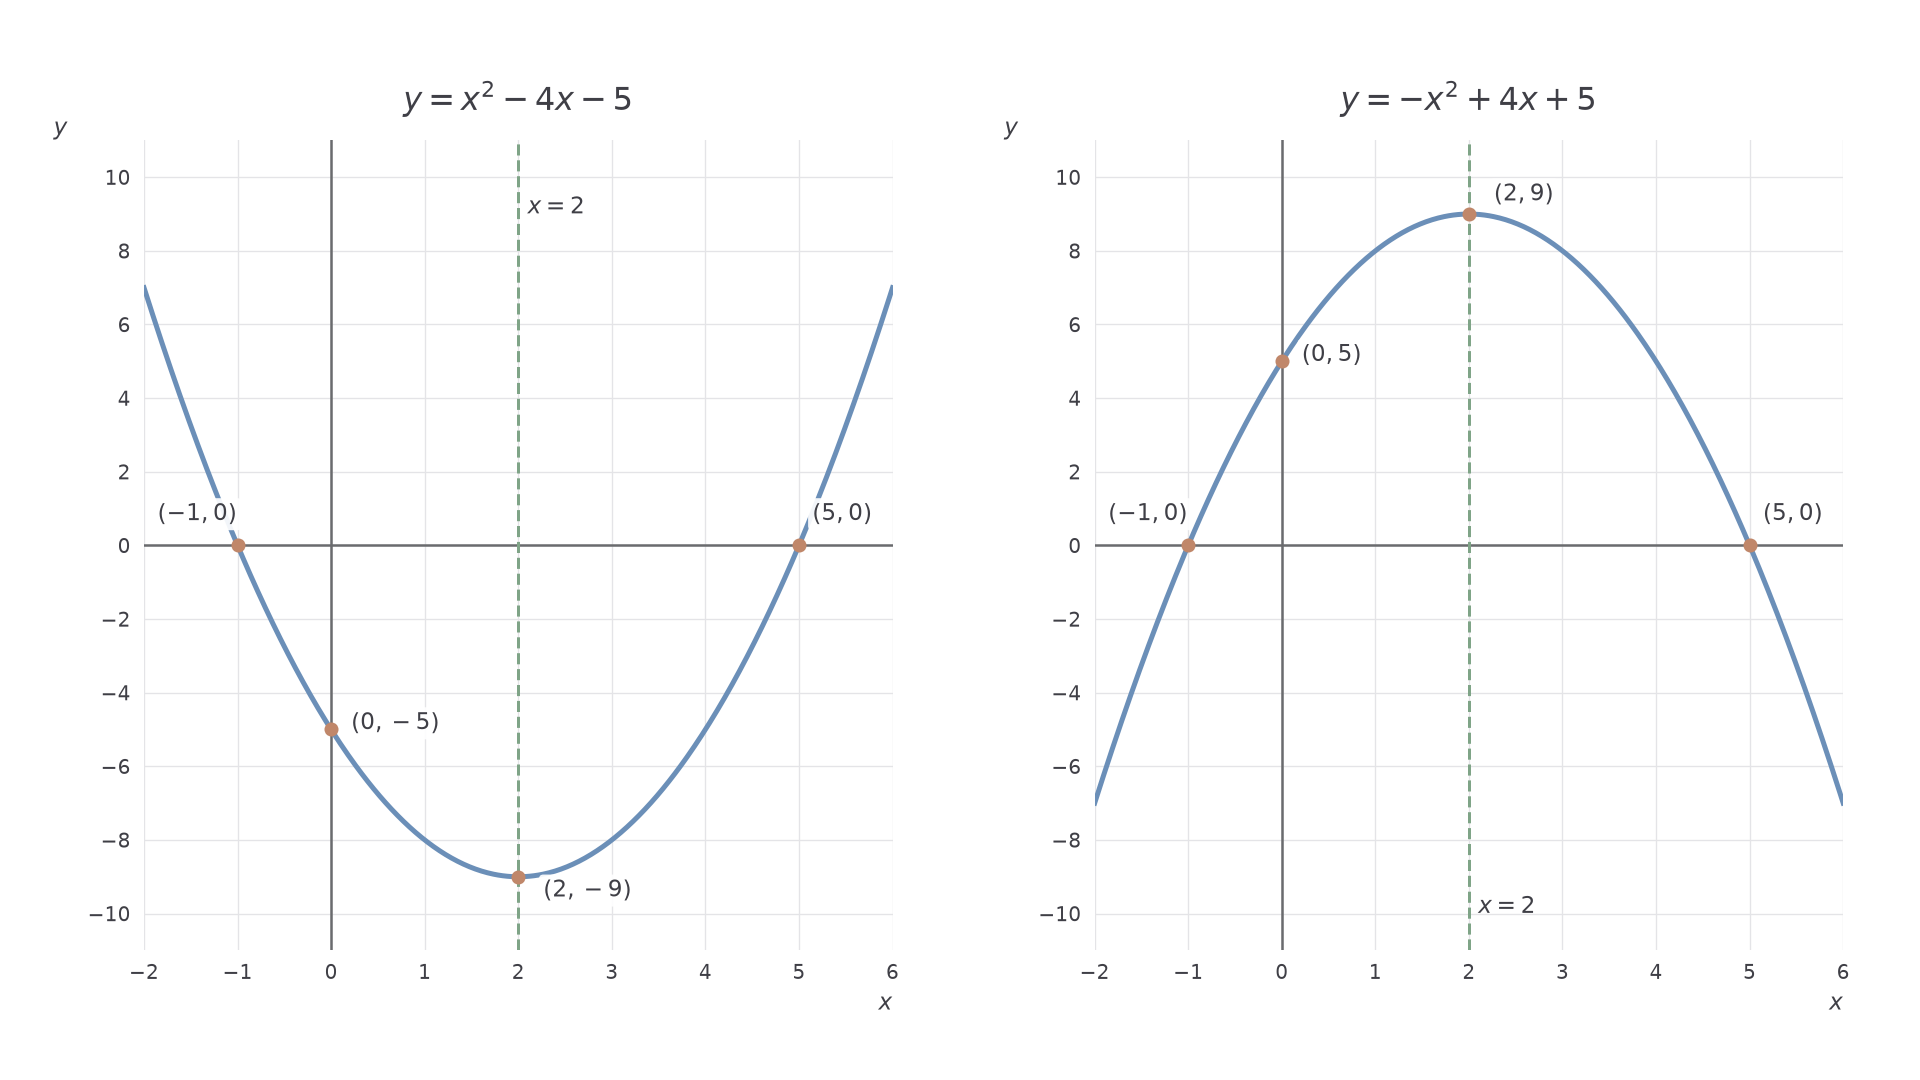
The first graph below illustrates the opening question. Read axis values rather than judging a point by its apparent position on the page.
[DIAGRAM: asset_name: Reading quadratic features; asset_slug: aqa8300_a20_features; caption: The roots are equally spaced around the turning point's x-coordinate; description: Two coordinate panels show y equals x squared minus 4x minus 5 and y equals minus x squared plus 4x plus 5. Roots at minus 1 and 5, y-intercepts minus 5 and 5, turning points 2 comma minus 9 and 2 comma 9, and dashed symmetry lines x equals 2 are labelled.]
Worked example 3: reading an upward-opening graph
Question. A quadratic graph has -intercepts and , -intercept , and minimum height . Write down its roots and turning point. Non-calculator.
Plan. Read the roots from the horizontal crossings, then find their midpoint for the turn's horizontal position.
Why this step? The roots have the same height, zero, so symmetry places the turning point halfway between them horizontally.
Answer. Roots and ; turning point .
Check. Both roots are units from .
Change only the vertical direction of the graph: every height is negated. The roots and symmetry line stay put.
Worked example 4: reading a downward-opening graph
Question. A quadratic graph has the same -intercepts, -intercept , and maximum height . Write down its roots and turning point. Non-calculator.
Plan. Keep the midpoint calculation and use the new maximum height.
Why this step? A maximum and a minimum are both turning points. The sign of the leading coefficient decides which kind you have.
Answer. Roots and ; turning point .
Check. The maximum is above the -intercept, as a highest point must be.
Continue this lesson.
You’re previewing NovaLearn without an account. Create a free account to read the rest.
Create free account