4.7.4.2 - Pyramids of biomass
A pyramid of biomass is a way to show how much living material is present at each level of a food chain. In this biology-only AQA point, the key skill is construction: given suitable data, you should be able to turn the numbers into an accurate pyramid with trophic level 1 at the bottom.
What biomass pyramids show
A food chain shows feeding relationships. A pyramid of biomass shows a different idea: the relative amount of biomass in each trophic level of that food chain.
Biomass
The mass of living material in organisms. In a biomass pyramid, this is usually the total biomass at a trophic level, often measured per unit area such as g m^-2.
Each horizontal bar represents one trophic level. A wider bar means a greater biomass at that level. A narrower bar means a smaller biomass at that level.
The pyramid is not counting individuals. One fox has more mass than one blade of grass, but the producer level can still have a much greater total biomass because it includes all the producer material in the area being considered.
Placing trophic levels
Trophic level 1 is always placed at the bottom of a biomass pyramid. In a typical food chain, trophic level 1 is the producer level, such as plants or algae.
| Trophic level | Position in the pyramid | Example in a food chain |
|---|---|---|
| Level 1 | Bottom bar | Grass |
| Level 2 | Above level 1 | Rabbit |
| Level 3 | Above level 2 | Fox |
The feeding arrows in a food chain usually go from left to right, but a pyramid is built from bottom to top. The first organism in the food chain goes in the bottom bar, then the next organism goes in the bar above it.
A common mistake is to draw the pyramid upside down because the predator feels like it is "at the top" of the food chain. The predator may be the top consumer, but trophic level 1 still goes at the bottom of the biomass pyramid.
Constructing from data
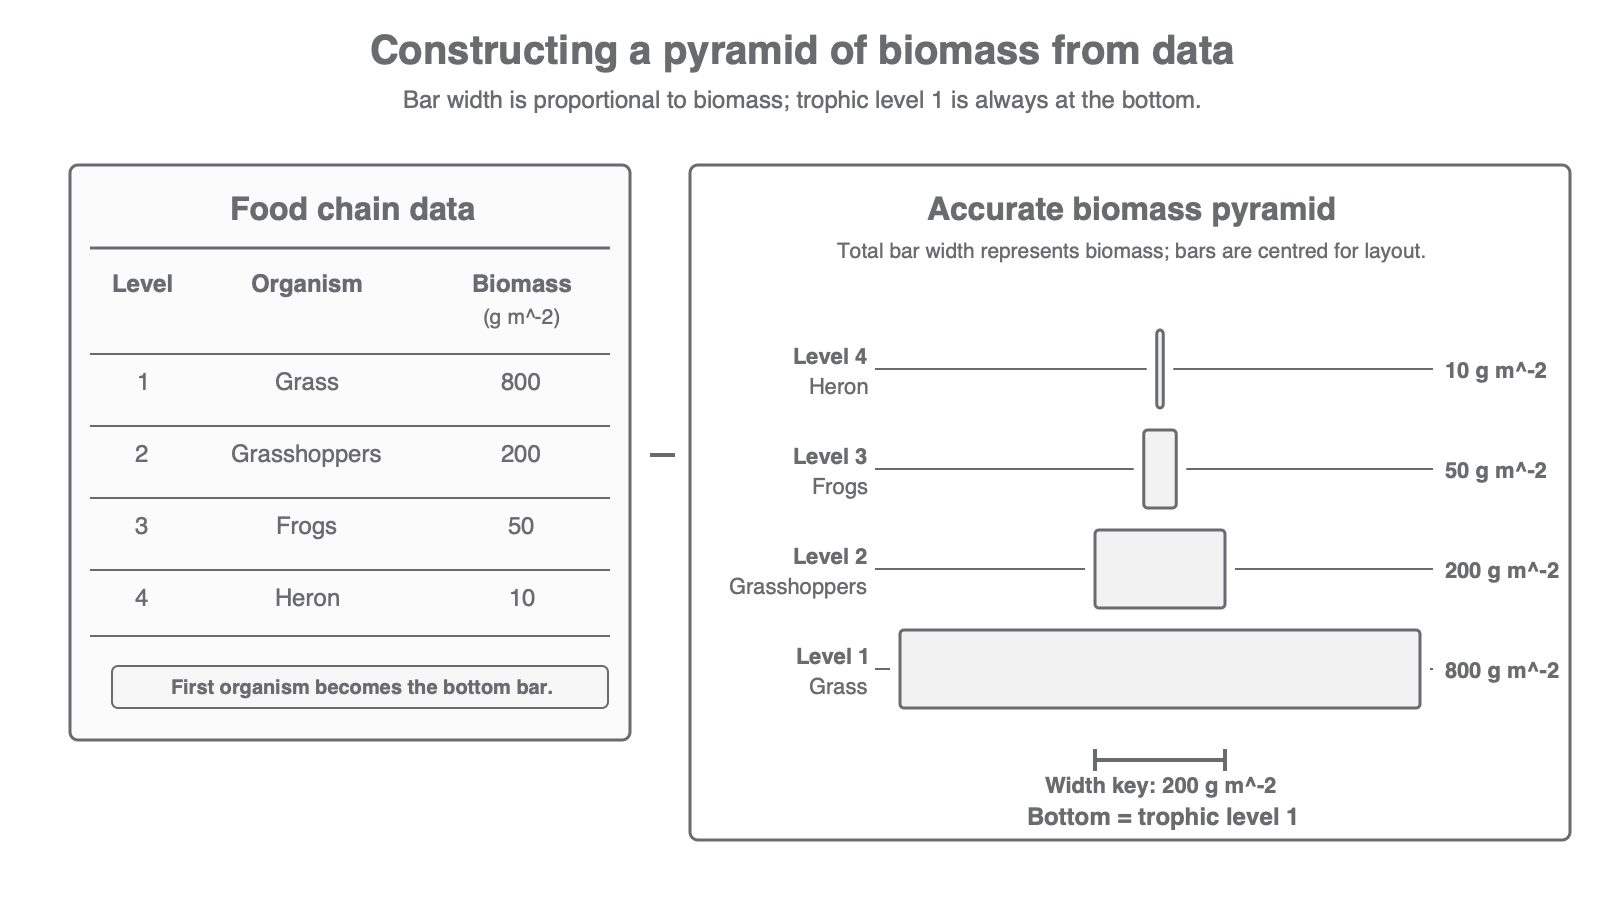
To construct an accurate pyramid of biomass, start with the data, not with a guessed triangle. The bars should be proportional to the biomass values.
[DIAGRAM: asset_name: constructing-biomass-pyramid - diagram 1; asset_slug: 112_4_7_4_2_pyramids_of_biomass_diagram1; file: diagram_assets/112_4_7_4_2_pyramids_of_biomass_diagram1.png; recommended_method: deterministic_drawn; description: Monochrome data-to-diagram visual showing a food chain data table for grass, grasshoppers, frogs and heron, then a correctly ordered and scaled pyramid of biomass with trophic level 1 at the bottom, centred bars, labels, and a proportional biomass-width key in g m^-2.]
Continue this lesson.
You’re previewing NovaLearn without an account. Create a free account to read the rest.
Create free account