4.6.1.6b - Genetic crosses and Punnett squares
A genetic cross is a model for predicting the possible offspring from two parents. In this lesson, the cross is always a single-gene cross with two alleles, because that is the GCSE boundary for Punnett-square probability. The aim is to move confidently between a Punnett square, genotype ratios, phenotype ratios, fractions and percentages.
Single-gene crosses
A genetic cross shows how alleles from two parents could combine in their offspring. A Punnett square is a table that organises those possible allele combinations.
Genetic cross
A model that predicts the possible allele combinations in offspring from two parents.
For this lesson, the characteristic is controlled by one gene. Each parent passes on one allele in each gamete. Fertilisation then combines one allele from each parent to make the offspring genotype.
The letters used in a question are just symbols for alleles. A capital letter normally represents the dominant allele and the matching lower-case letter represents the recessive allele. For example, if F is dominant and f is recessive, an offspring with FF or Ff shows the dominant phenotype, while an offspring with ff shows the recessive phenotype.
Most real phenotype features are controlled by several genes and sometimes by environmental factors as well. A Punnett square is therefore a useful GCSE model for a named single-gene characteristic, not a complete model for every human or animal feature.
Complete a Punnett square
In a completed Punnett square, the gametes from one parent are written along the top and the gametes from the other parent are written down the side. Each inner box combines one allele from the top with one allele from the side.
[DIAGRAM: asset_name: heterozygous-cross-punnett-square - diagram 1; asset_slug: 076_4_6_1_6b_genetic_crosses_and_punnett_squares_diagram1; file: diagram_assets/076_4_6_1_6b_genetic_crosses_and_punnett_squares_diagram1.png; recommended_method: deterministic_drawn; description: Monochrome completed Punnett square for a single-gene cross Ff x Ff with gametes F and f from each parent, offspring genotypes FF, Ff, Ff and ff, and summary genotype ratio 1 FF to 2 Ff to 1 ff, phenotype ratio 3 dominant to 1 recessive, probabilities 75 percent dominant and 25 percent recessive.]
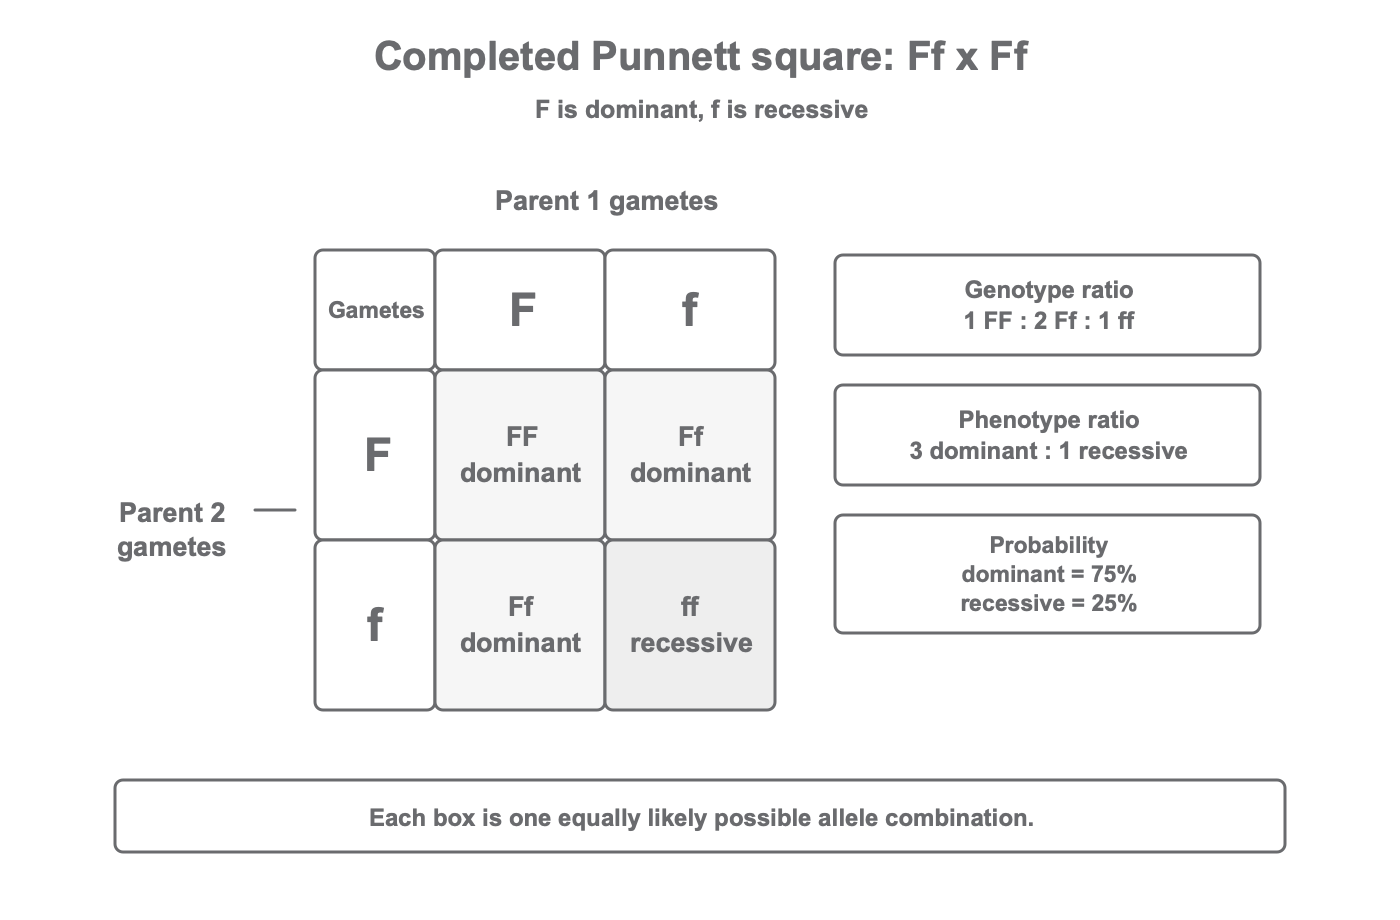
The diagram shows the cross Ff x Ff. Each parent is heterozygous, so each can produce two types of gamete: F and f. The four possible offspring genotypes are FF, Ff, Ff and ff.
The genotype ratio is:
1 FF : 2 Ff : 1 ff
The phenotype ratio is different because F is dominant. Both FF and Ff show the dominant phenotype, so the phenotype ratio is:
3 dominant phenotype : 1 recessive phenotype
Ratios and probability
Punnett-square outcomes can be expressed as ratios, fractions, decimals or percentages. The denominator is the total number of equally likely boxes in the square.
Probability from a Punnett square
For a four-box Punnett square, one box is 1/4, two boxes are 2/4, three boxes are 3/4 and four boxes are 4/4. These can be written as percentages:
| Boxes with outcome | Fraction | Percentage |
|---|---|---|
| 1 out of 4 | 1/4 | 25% |
| 2 out of 4 | 1/2 | 50% |
| 3 out of 4 | 3/4 | 75% |
| 4 out of 4 | 1 | 100% |
A different cross can give a different ratio. If a heterozygous parent is crossed with a homozygous recessive parent, the expected phenotype ratio is often 1 dominant : 1 recessive.
[DIAGRAM: asset_name: heterozygous-recessive-punnett-square - diagram 2; asset_slug: 076_4_6_1_6b_genetic_crosses_and_punnett_squares_diagram2; file: diagram_assets/076_4_6_1_6b_genetic_crosses_and_punnett_squares_diagram2.png; recommended_method: deterministic_drawn; description: Monochrome completed Punnett square for Ff x ff with parent gametes F and f crossed with f and f, offspring genotypes Ff, ff, Ff and ff, and summary phenotype ratio 1 dominant to 1 recessive with probabilities 50 percent each.]
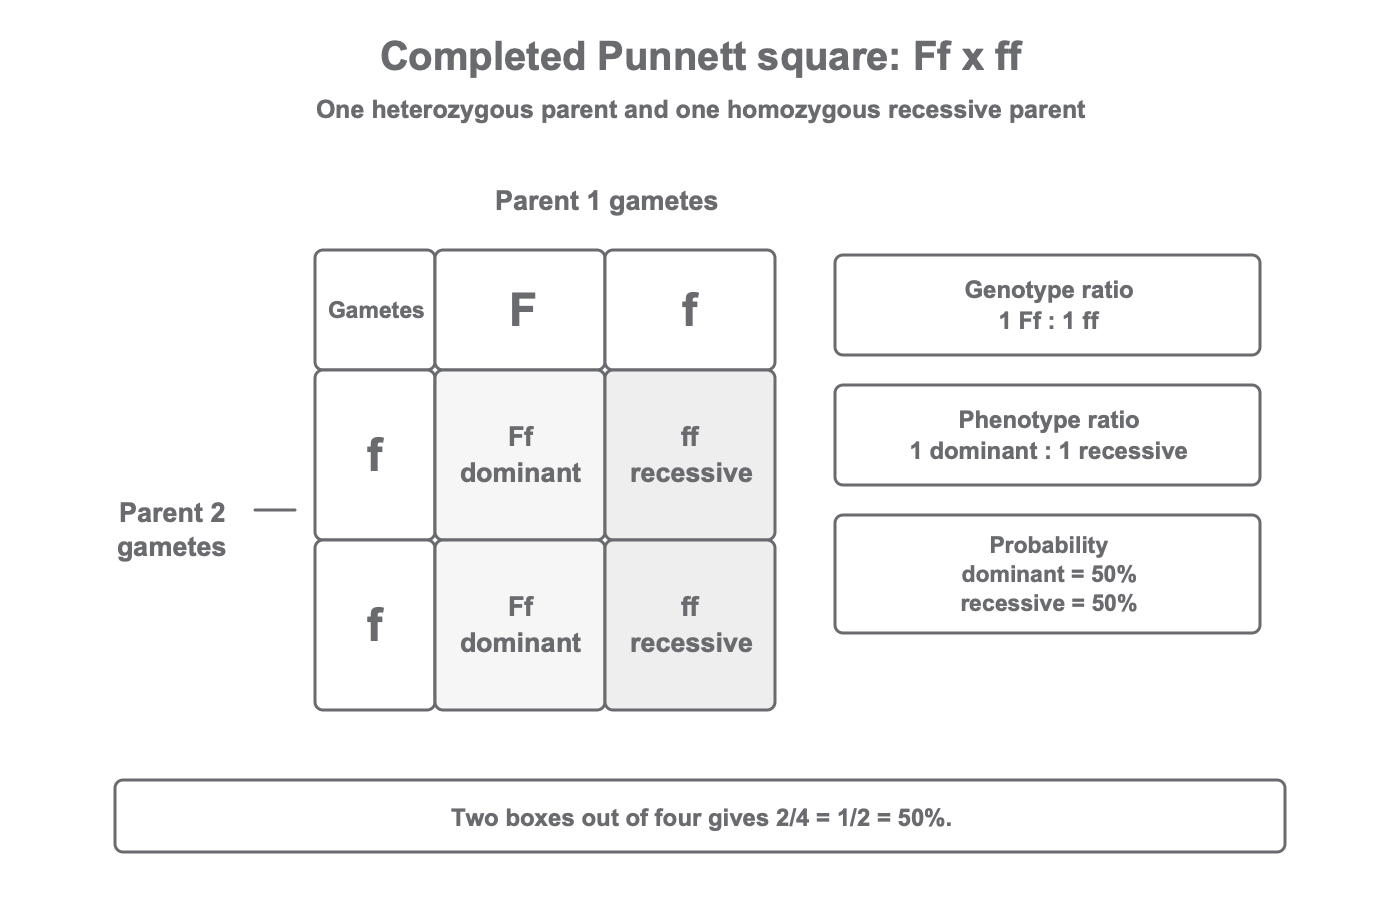
In the Ff x ff cross, two boxes are Ff and two boxes are ff. The genotype ratio is 1 Ff : 1 ff, and the phenotype probability is 50% dominant phenotype and 50% recessive phenotype.
These probabilities are predictions for each fertilisation event. They do not mean that every family with four offspring must have exactly three dominant-phenotype offspring and one recessive-phenotype offspring. Chance can make small actual numbers differ from the expected ratio.
Continue this lesson.
You’re previewing NovaLearn without an account. Create a free account to read the rest.
Create free account