4.7.2.1a - Ecosystem Levels and Food Chains
Ecologists study living organisms at different scales, from one individual organism to the whole ecosystem. In this lesson, you will connect those levels to feeding relationships, food chains, sampling data and predator-prey cycles. The important thread is simple: producers make biomass, consumers depend on that biomass, and population sizes can be studied using evidence.
Levels in an ecosystem
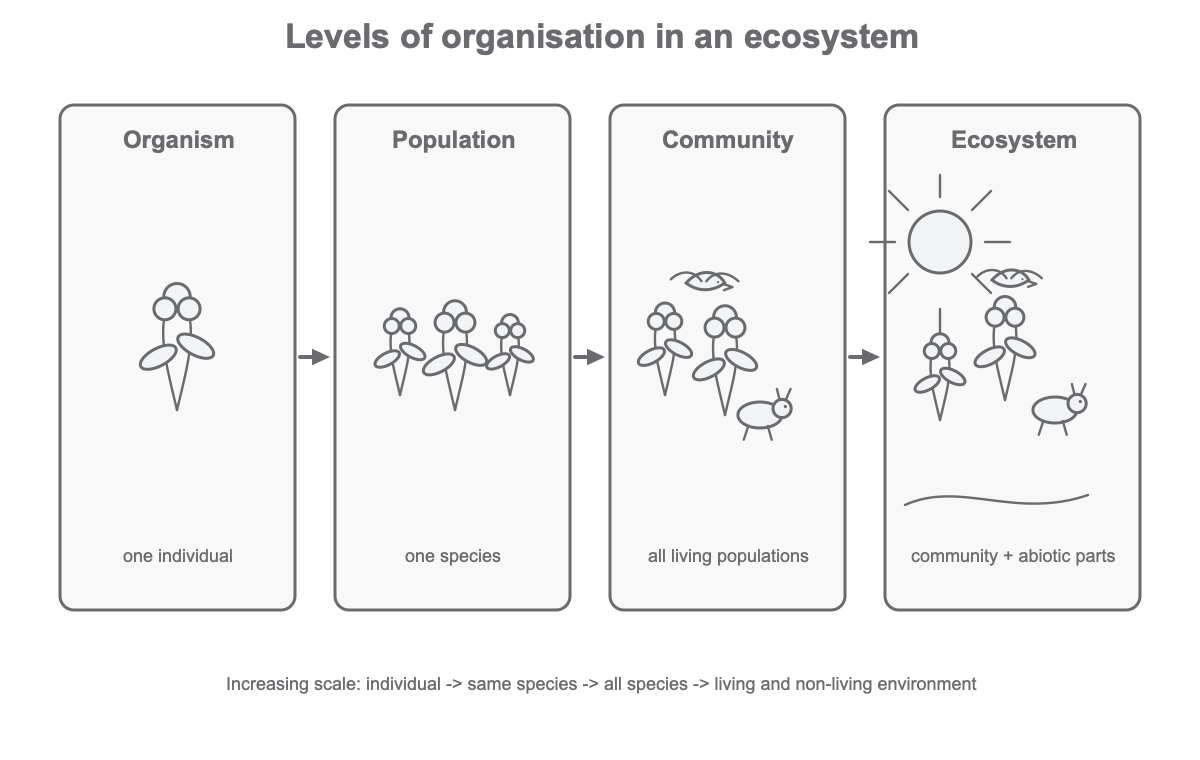
An ecosystem is easier to understand if you keep the levels of organisation separate. Each level is bigger than the one before it.
- An organism is one individual living thing.
- A population is all the organisms of one species living in the same place.
- A community is all the populations of different species living together in a habitat.
- An ecosystem is the community plus the non-living parts of the environment, such as water, soil, light, temperature and mineral ions.
A stable community is not one where nothing changes. It is one where the species and environmental factors are in balance, so population sizes stay fairly constant over time. They may rise and fall, but they do not usually crash to zero or grow without limit.
[DIAGRAM: asset_name: ecosystem_levels_overview: Levels of organisation in an ecosystem - diagram 1; asset_slug: 099_4_7_2_1a_ecosystem_levels_and_food_chains_diagram1; file: diagram_assets/imagegen_regen_all/099_4_7_2_1a_ecosystem_levels_and_food_chains_diagram1_imagegen.png; recommended_method: codex_image_gen; description: Monochrome flow diagram showing organism, population, community and ecosystem, with living and non-living components kept visually separate.]
Producers and food chains
Photosynthetic organisms are the producers of biomass for life on Earth. They make glucose by photosynthesis, then use glucose to make other biological molecules. Those molecules become biomass: the material that living organisms are made from.
All food chains begin with a producer. This is usually a green plant or alga. A food chain represents feeding relationships within a community, and each arrow points from the organism being eaten to the organism that eats it.
[DIAGRAM: asset_name: producer_food_chain: Producer-to-tertiary-consumer food chain - diagram 2; asset_slug: 099_4_7_2_1a_ecosystem_levels_and_food_chains_diagram2; file: diagram_assets/imagegen_regen_all/099_4_7_2_1a_ecosystem_levels_and_food_chains_diagram2_imagegen.png; recommended_method: codex_image_gen; description: Monochrome food chain beginning with grass as producer, then primary consumer, secondary consumer and tertiary consumer, with arrows labelled as biomass transfer by feeding.]
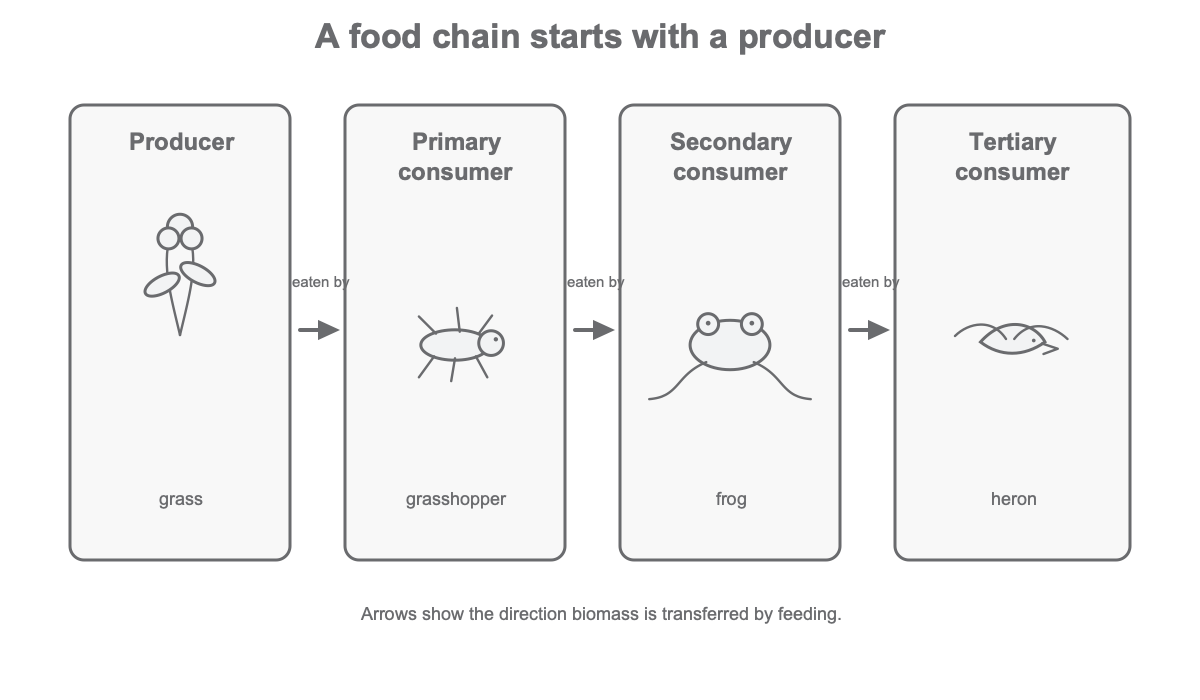
The names in a food chain tell you what each organism is feeding on.
- A producer synthesises molecules and makes biomass.
- A primary consumer eats a producer.
- A secondary consumer eats a primary consumer.
- A tertiary consumer eats a secondary consumer.
Do not reverse the arrow. In grass -> grasshopper -> frog, the grasshopper eats the grass, and the frog eats the grasshopper. The arrow points in the direction that biomass is transferred by feeding.
Sampling abundance data
Ecologists often need evidence about organisms in a habitat. Two important ideas are distribution and abundance.
Distribution means where a species is found in a habitat. Abundance means how many organisms of a species are found there. Ecologists use sampling because it is usually not practical to count every individual organism in a whole ecosystem.
A quadrat is a square frame placed on the ground to sample a known area. It is most useful for plants and slow-moving animals. A transect is a line, often a tape measure, placed across a habitat. Quadrats can be placed along the transect to see how distribution and abundance change with distance or with a changing factor such as light intensity.
Continue this lesson.
You’re previewing NovaLearn without an account. Create a free account to read the rest.
Create free account