4.4.1.2a - Rate of Photosynthesis and Limiting Factors
Photosynthesis does not happen at one fixed speed. Its rate depends on conditions such as light intensity, temperature, carbon dioxide concentration and the amount of chlorophyll. This lesson focuses on explaining those effects, using rate calculations and interpreting graphs without drifting into the full required-practical method.
Rate and named factors
The rate of photosynthesis means how much photosynthesis happens in a given time. In school investigations and exam data, this is often represented by oxygen produced per minute, bubbles per minute, or volume of gas per minute.
Rate of photosynthesis
The amount of photosynthesis happening per unit time, often measured using oxygen produced per minute.
Photosynthesis uses carbon dioxide and water to make glucose and oxygen. Light transfers energy to chloroplasts, where chlorophyll absorbs light. If one needed condition is too low, the rate of photosynthesis is lower.
The four named factors for this lesson are:
| Factor | Why it affects the rate |
|---|---|
| Light intensity | Light transfers energy to the chloroplasts. At low light intensity, less energy is available for photosynthesis. |
| Carbon dioxide concentration | Carbon dioxide is a reactant in photosynthesis. If too little carbon dioxide is available, less glucose can be made per minute. |
| Temperature | Photosynthesis is controlled by enzymes. Low temperature slows enzyme-controlled reactions; very high temperature can denature enzymes. |
| Amount of chlorophyll | Chlorophyll absorbs light. If a leaf has less chlorophyll, it may absorb less light for photosynthesis. |
Do not treat every factor as if it has the same graph shape. Light intensity and carbon dioxide concentration usually increase the rate until the graph levels off. Temperature usually rises to an optimum and then falls if enzymes denature.
One-factor graphs
A one-factor graph changes one factor and keeps the others as controlled as possible. The independent variable goes on the x-axis, and the rate of photosynthesis goes on the y-axis.
[DIAGRAM: asset_name: one_factor_graph_trends - diagram 1; asset_slug: 044_4_4_1_2a_rate_of_photosynthesis_and_limiting_factors_diagram1; file: diagram_assets/044_4_4_1_2a_rate_of_photosynthesis_and_limiting_factors_diagram1.png; recommended_method: deterministic_drawn; description: Monochrome deterministic 2x2 graph panel showing GCSE trend shapes for rate of photosynthesis against light intensity, carbon dioxide concentration, temperature and amount of chlorophyll. Light, carbon dioxide and chlorophyll curves rise then level off; temperature rises to an optimum then falls. Axes are labelled and a note says trends are teaching shapes, not universal values.]
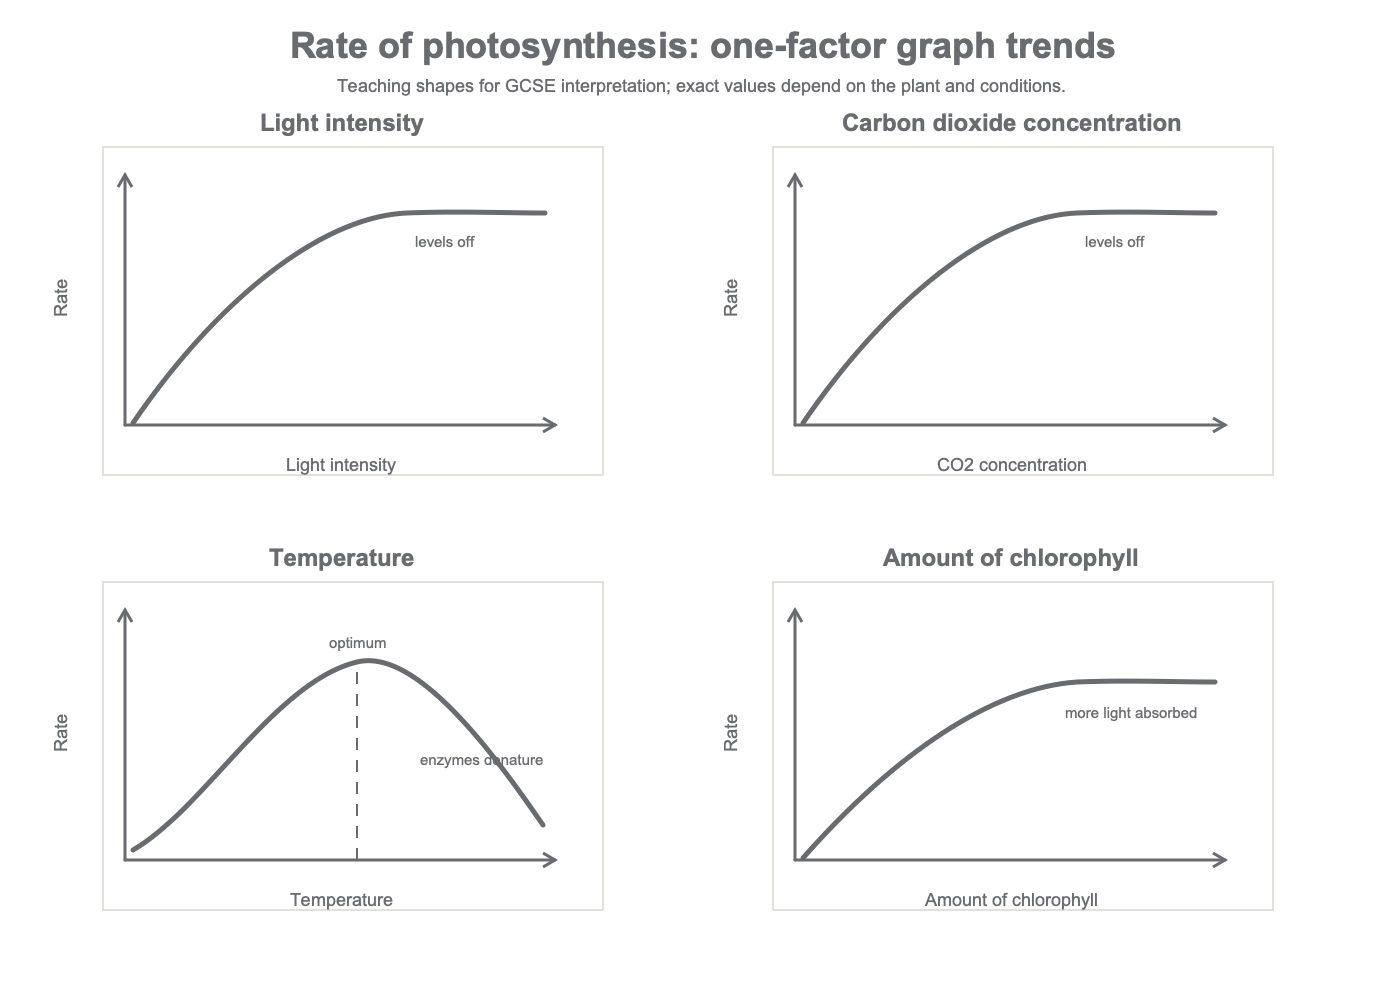
When light intensity is the x-axis, the rate often increases at first because light is the factor in shortest supply. Then the graph levels off. The plateau does not mean photosynthesis has stopped; it means increasing light intensity further does not increase the rate because something else is now limiting.
Carbon dioxide concentration has a similar GCSE shape: more carbon dioxide increases the rate at first because carbon dioxide is a reactant. Once another factor limits the rate, adding more carbon dioxide has little or no effect on the rate.
Temperature is different. As temperature rises towards the optimum, enzyme-controlled reactions happen faster. Above the optimum, enzymes may denature, so the rate falls.
Amount of chlorophyll can also affect the rate because chlorophyll absorbs light. A plant with less chlorophyll may have a lower rate of photosynthesis, especially when light absorption is limiting.
Worked example:
| Light intensity in arbitrary units | Rate of oxygen production in cm3/min |
|---|---|
| 0 | 0.0 |
| 20 | 1.2 |
| 40 | 2.4 |
| 60 | 3.0 |
| 80 | 3.0 |
The rate increases from 0.0 cm3/min to 3.0 cm3/min as light intensity increases from 0 to 60 arbitrary units. It then levels off at 3.0 cm3/min between 60 and 80 arbitrary units, so light is no longer the factor limiting the rate in that region.
Rates and graph skills
Rate calculations use the same relationship as other GCSE biology rate questions.
Rate
For photosynthesis, the change could be the number of oxygen bubbles, the volume of oxygen produced, or another measure given in the question. The unit must match the data. If oxygen volume is in cm3 and time is in min, the rate is in cm3/min.
Worked example:
A student records 18 cm3 of oxygen produced in 6 min.
- Write the relationship:
rate = change / time - Substitute:
rate = 18 cm3 / 6 min - Calculate:
rate = 3 cm3/min
If repeated results are given, calculate a mean unless the question tells you to exclude an anomalous result. For graph questions, select a scale that covers the full data range and uses most of the axis. A line graph is usually suitable when the independent variable is continuous, such as light intensity, carbon dioxide concentration or temperature.
When interpreting a graph or table, use this routine:
- Name the factor on the x-axis.
- Describe the trend using increase, decrease, maximum, optimum or level off.
- Quote numbers and units from the data.
- Explain the pattern using the limiting factor.
HT limiting-factor interactions
Higher tier only: the named factors can interact. Any one of them may be the factor that limits photosynthesis.
Limiting factor
A limiting factor is the factor in shortest supply that prevents the rate of a process from increasing further.
In photosynthesis, this means adding more of the limiting factor can increase the rate, but adding more of a non-limiting factor may not. For example, if carbon dioxide concentration is very low, giving the plant more light may have little effect because carbon dioxide is the factor holding back the reaction.
Continue this lesson.
You’re previewing NovaLearn without an account. Create a free account to read the rest.
Create free account