HS5–HS6 - Box plots and comparing distributions
Two services can have similar typical waits but very different consistency. HS5–HS6 summarises distributions with five numbers, represents them on box plots, and uses centre and spread together while considering outliers and the population sampled.
Five-number summaries
A box plot needs five ordered values rather than every observation. First distinguish an exact raw list from a grouped curve, whose readings are estimates.
The five-number summary
The five-number summary is minimum, lower quartile , median, upper quartile , maximum, in that order. The range is maximum minus minimum; the interquartile range is . The median measures centre, while the IQR measures spread across the middle half of the distribution.
For the raw lists below, use this median-of-halves convention: sort the data, find the overall median, then take the medians of the lower and upper halves as . With an odd number of values, leave the overall middle value out of both halves. If a question states a different quartile-position convention, follow it. For a grouped cumulative curve, use the quarter-total heights taught previously instead.
Worked example 1: an even number of observations
Question. Eight waits, in minutes, are . Find the five-number summary using the stated convention.
Plan. Order the eight observations, average the middle pair for the median, and find the middle of each four-value half.
The ordered list is
The overall median is . The lower-half median is ; the upper-half median is .
Answer. Minimum , , median , , maximum minutes.
Check. All eight original values occur exactly once in the ordered list. The range is , and , both smaller than or equal to the full spread as expected. All five summary values are correctly ordered.
With an odd-sized list, exclude the single overall middle value when forming the two halves.
Worked example 2: an odd number of observations
Question. Nine waits are minutes. Find the five-number summary using the stated median-of-halves convention.
Plan. Find the fifth ordered value, then form two four-value halves without that value.
Ordered data:
The median is eighteen. For the lower half, . For the upper half, .
Answer. minutes, in five-number order.
Check. Four values lie on each side of the excluded middle value; reinserting it gives nine observations, not ten. The range is and the IQR is . The quartiles lie on opposite sides of the median within the observed extremes.
Quartile positions summarise quarters of an ordered distribution, but ties and small-sample conventions can prevent a literal count of exactly one quarter strictly below a quartile. For grouped data, do not treat class endpoints as exact observed minima or maxima unless the question supplies that information.
Watch out
Order the data before finding any median or quartile. A middle entry in an unsorted list has no statistical significance.
Summarise a fresh odd-sized list.
Box plots
A box plot turns five positions into a visual summary on one numerical scale. Its lengths represent differences in the measured variable, not numbers of observations.
Box and whiskers
Draw a box from to , with a line at the median. For the standard five-number plots here, draw whiskers from the box to the observed minimum and maximum, with end marks. Use a uniform labelled scale. The box spans the middle half by quartile position; a longer section shows greater spread across that portion.
Mark all five positions before joining them. The median need not be in the centre of the box, and the whiskers need not have equal lengths. Horizontal and vertical box plots use the same principles; read the numerical axis, not the plot's orientation.
Worked example 3: construct a box plot
Question. Construct a horizontal box plot for Sample A with summary minutes.
Plan. Put the five values on a uniform time axis, then join only the appropriate parts.
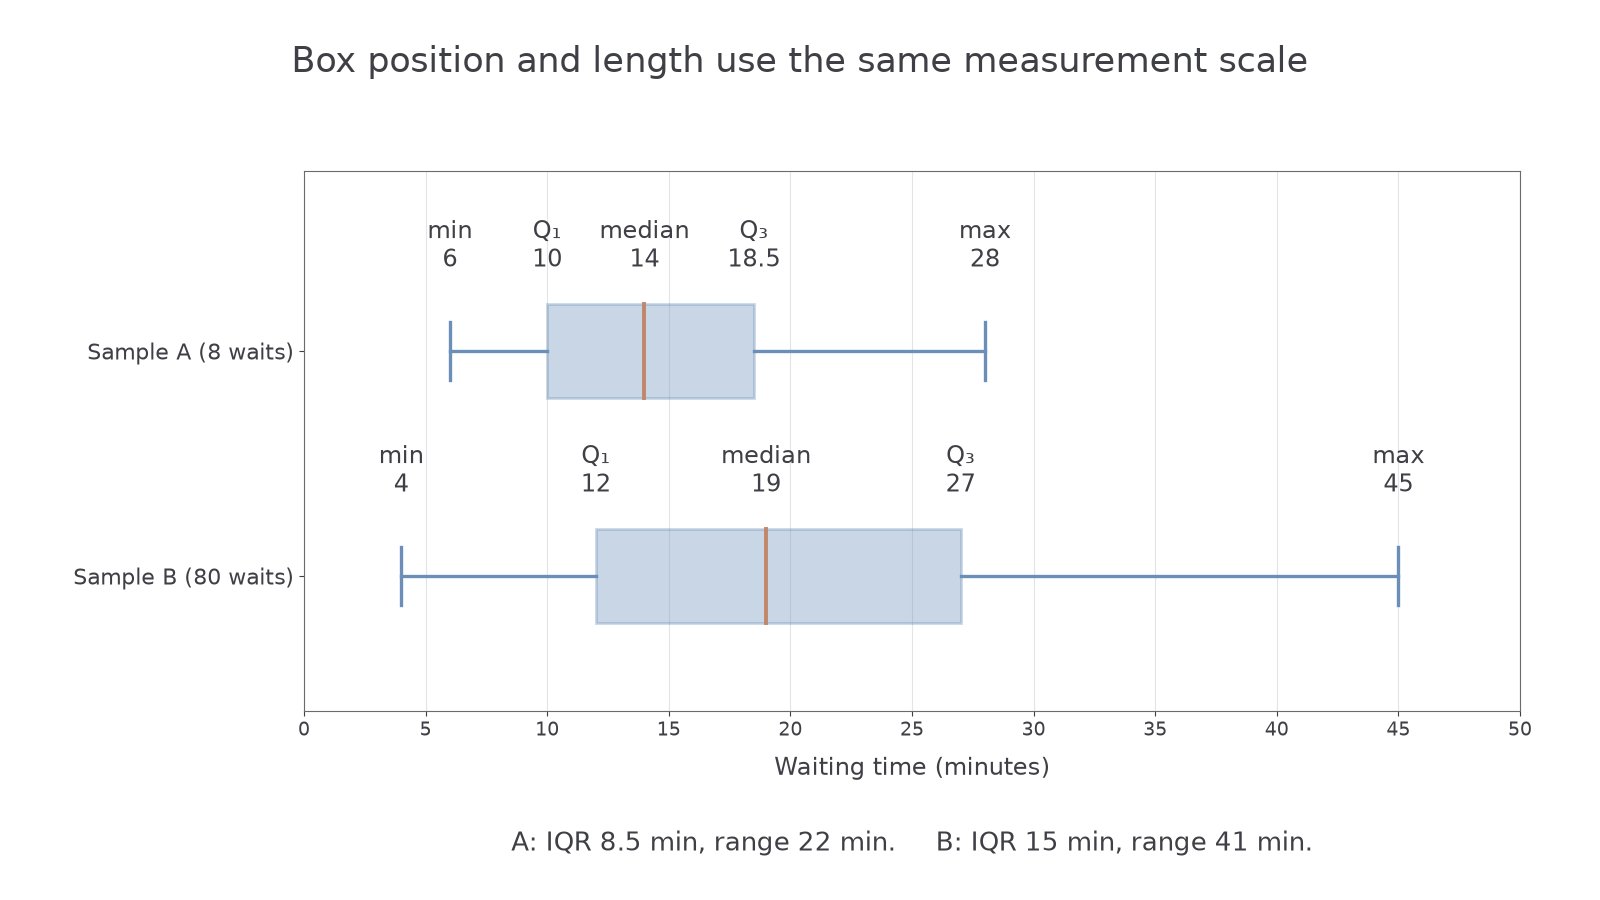
Draw the box from ten to , the median line at fourteen, and whiskers reaching six and twenty-eight. The first row of the diagram below shows the completed plot.
Answer. A box with width minutes, median at fourteen, and whisker endpoints six and twenty-eight.
Check. The left whisker length is , the box length , and the right whisker length . Their sum is , matching maximum minus minimum. The median lies inside the box, as required.
A supplied IQR can be used to find a missing quartile before drawing.
Worked example 4: complete and interpret a summary
Question. Sample B has eighty waits, minimum four, lower quartile twelve, median nineteen, IQR fifteen and maximum forty-five minutes. Find its upper quartile, construct its box plot, and estimate how many waits are above that quartile.
Plan. Recover from , then use the upper-quarter interpretation.
Draw the box from twelve to twenty-seven, its median at nineteen, and whiskers to four and forty-five. Approximately one quarter of the observations lie in the upper quarter, so the estimated number above is .
Answer. Upper quartile twenty-seven minutes; box plot as in the second row; about twenty waits above it.
Check. , recovering the supplied IQR, and . The estimate of twenty uses quartile position; the five numbers alone do not give an exact count when values are tied at the boundary.
The plots use a common time scale. Comparing box lengths on different scales would give a misleading comparison of spread.
[DIAGRAM: asset_name: Constructing five-number box plots; asset_slug: five-number-boxplots; caption: Place both summaries on the same scale; the box is Q1 to Q3 and the internal line is the median.; description: Two horizontal box plots share a zero-to-fifty-minute scale. Sample A has minimum6,Q1=10,median14,Q3=18.5,maximum28. Sample B has minimum4,Q1=12,median19,Q3=27,maximum45. All five positions are labelled for each sample.]
Continue this lesson.
You’re previewing NovaLearn without an account. Create a free account to read the rest.
Create free account