FA11–FA12, FA15, HA11–HA12, HA18 - Quadratic graphs and roots
How can a curve reveal two answers to one equation? FA12 and HA12 cover drawing quadratic graphs; FA11 and HA11 connect their roots, intercepts and turning points. Use the graphical parts of FA15 and HA18 to estimate solutions from crossings.
Plotting curves
For , one y-value may occur at two different x-values. Plotting a table makes this pattern visible.
A quadratic function has the form , where , and are constants and . Its graph is a smooth parabola. A positive coefficient of gives an upward-opening curve; a negative coefficient gives a downward-opening curve. Calculate a table by substituting each input into the whole expression. In particular, , while .
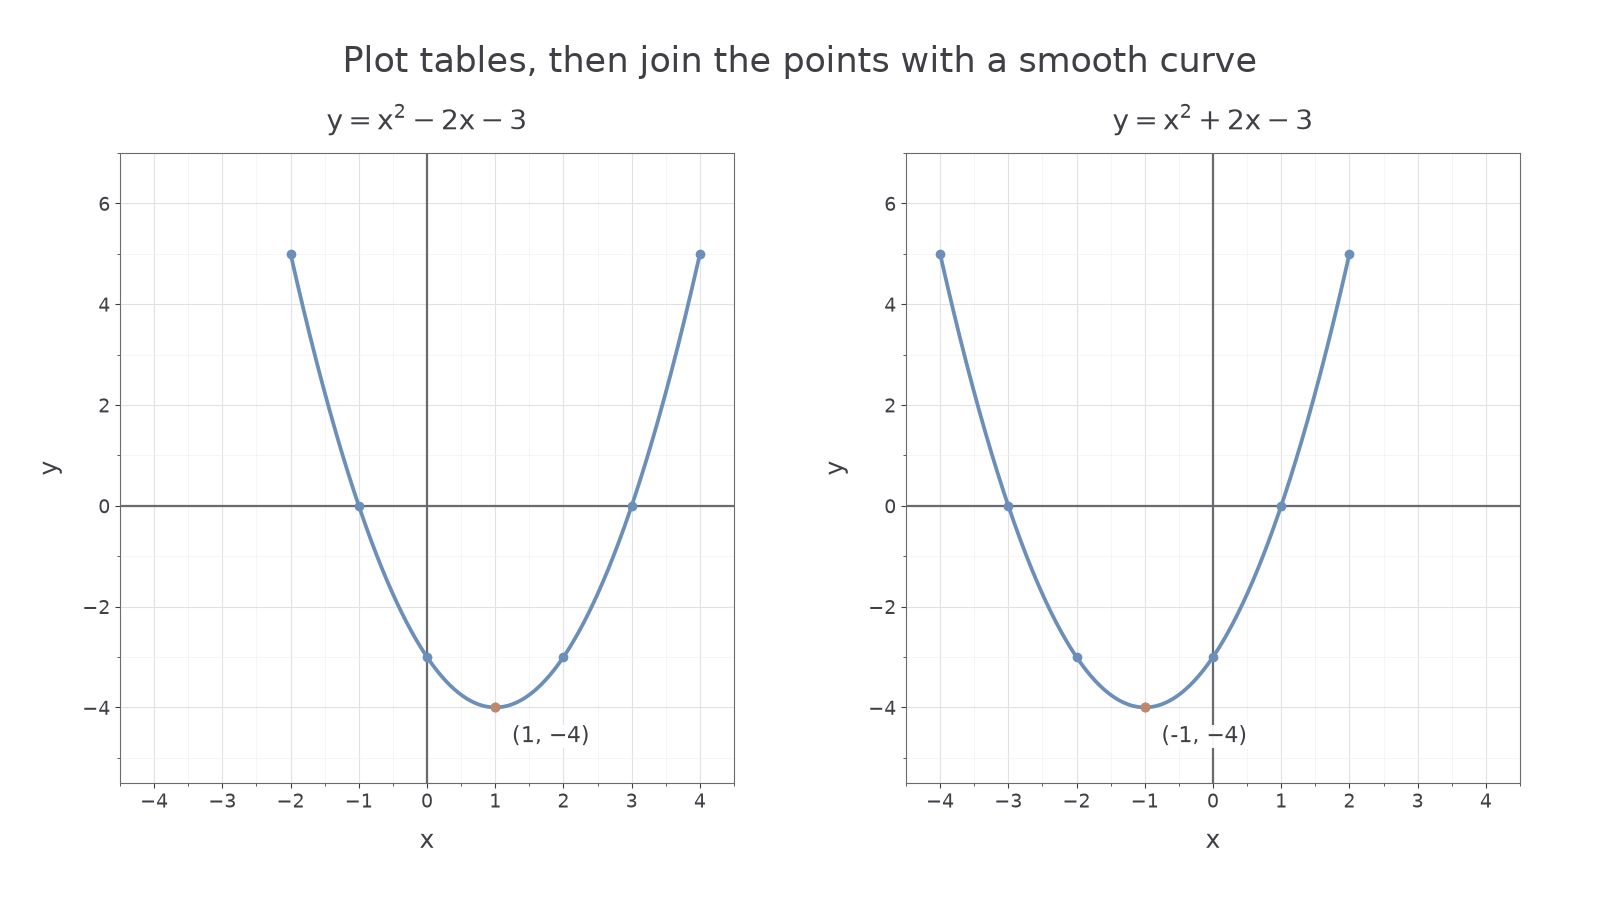
[DIAGRAM: asset_name: Plotting quadratic tables; asset_slug: quadratic-plotting; caption: Plot the calculated points and join them with a smooth curve, including the lowest point.; description: Two scaled grids show y equals x squared minus 2x minus 3 and y equals x squared plus 2x minus 3. Integer-coordinate table points are marked, with minimum points (1,-4) and (-1,-4), respectively.]
Worked example 1: a quadratic table
Question. Complete a table and draw for .
Plan. Substitute the integer x-values, plot the coordinate pairs and draw a smooth curve.
For example, at ,
Answer. The smooth upward-opening curve through these points, with its lowest point at .
Check. Points equally far from have equal heights: for example, and both give . A plotted point breaking this pattern needs checking.
Change the sign of the linear term and recalculate, rather than reuse coordinates from the first table.
Worked example 2: a changed linear term
Question. Draw for .
Plan. Make a new table, taking care with negative inputs.
At , .
Answer. A smooth upward-opening parabola, now with lowest point .
Check. The y-intercept remains , but the symmetry is now about . At , the original equation gives , confirming the table.
Use a ruler for axes and straight lines, but a smooth curve for a parabola. If a turning point lies between your table inputs, add more points nearby; straight segments between widely spaced points can hide it.
Watch out
Substituting into gives , not . Put negative inputs in brackets before squaring.
Calculate two points and choose the correct way to join them with the rest of a table.
Features of quadratics
A quadratic graph carries several different pieces of information. Keep a coordinate pair separate from a single value of or .
Roots and turning point
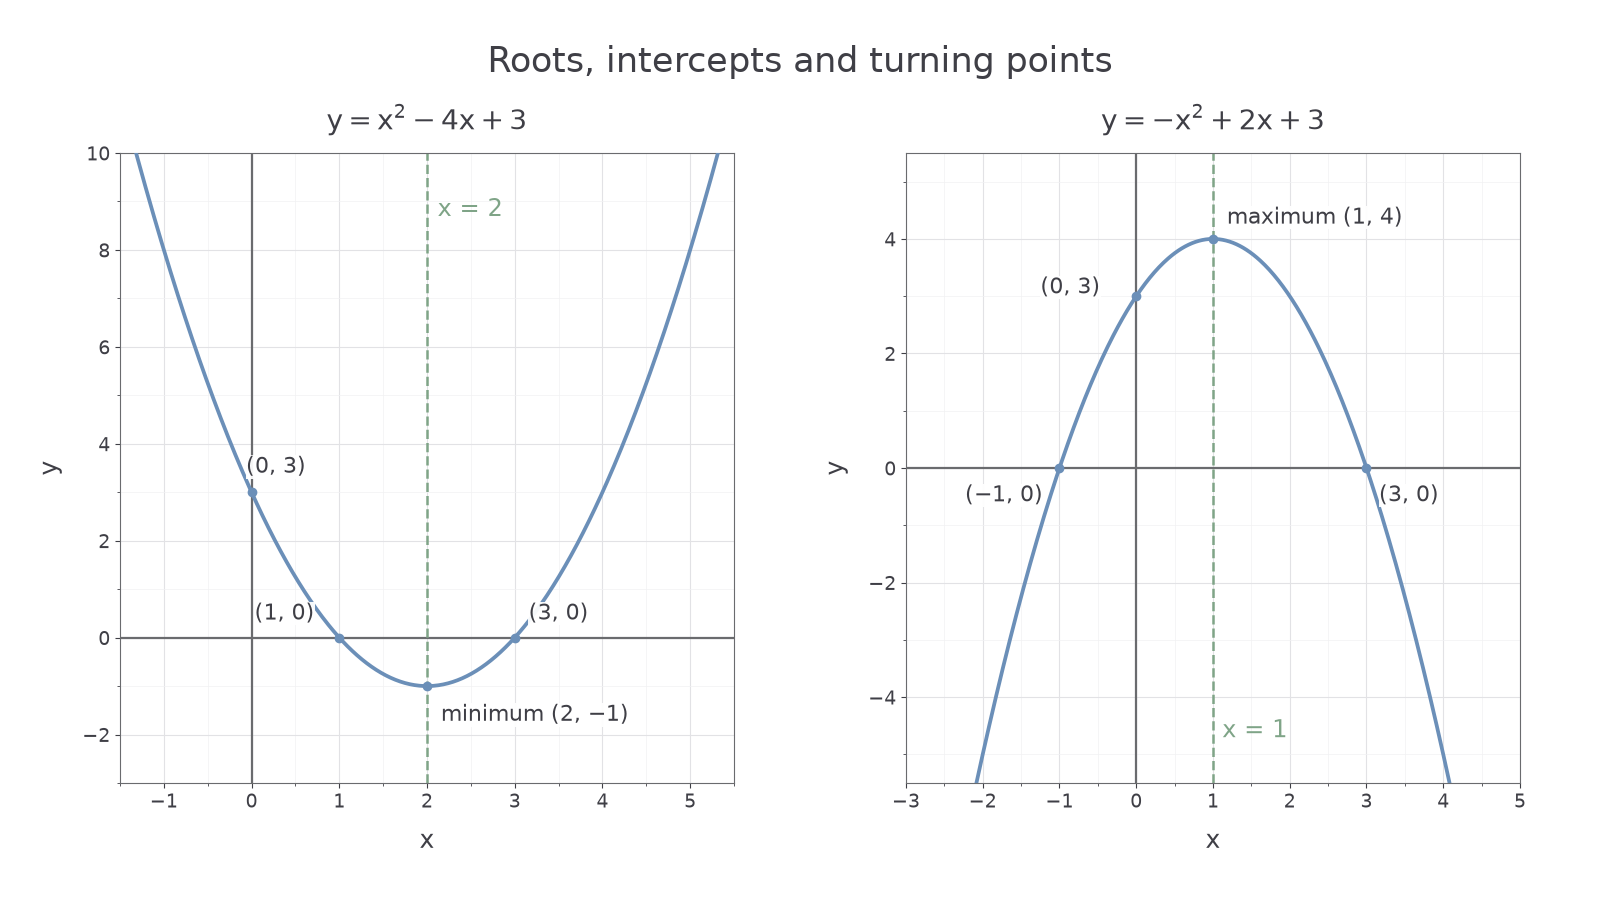
A root is an x-value where , so the graph meets the x-axis. The y-intercept occurs where . A turning point is the minimum or maximum point where the curve changes from decreasing to increasing, or vice versa. The vertical axis of symmetry passes through the turning point.
Read a turning point as , but write the axis as an equation . An upward quadratic has a minimum; a downward quadratic has a maximum. Depending on its position, a quadratic has two distinct real roots, one repeated real root where it just touches the x-axis, or no real roots where it misses that axis.
[DIAGRAM: asset_name: Quadratic features; asset_slug: quadratic-features; caption: The roots are horizontal-axis crossings; the turning point can be a minimum or a maximum.; description: Left grid shows y equals x squared minus 4x plus 3, roots 1 and 3, y-intercept 3 and minimum (2,-1), with symmetry line x equals 2. Right grid shows y equals minus x squared plus 2x plus 3, roots minus 1 and 3, y-intercept 3 and maximum (1,4), with symmetry line x equals 1.]
Continue this lesson.
You’re previewing NovaLearn without an account. Create a free account to read the rest.
Create free account