HS4 - Histograms and frequency density
Can a shorter histogram bar contain more observations than a taller one? HS4 makes frequency proportional to area, so class width matters as much as height. Use that relationship to construct fair diagrams, recover frequencies and estimate portions of groups.
Area represents frequency
A histogram represents grouped numerical data, including continuous measurements. Each bar spans its actual class interval along a numerical scale; adjacent intervals have touching bars. It is not a categorical bar chart with arbitrary equal widths and gaps.
Frequency density
In a histogram, bar area represents frequency. Use
Class width is upper boundary minus lower boundary. The vertical height is frequency per unit of the measured variable, rather than frequency itself.
Equal-width classes make heights proportional to frequencies, but the area rule remains the reason. If waiting time is measured in minutes, density has units people per minute of class width; this describes how observations are spread across waiting times, not the rate at which people arrive.
Worked example 1: construct equal-width bars
Question. Draw a histogram for these waiting times, using frequency density on the vertical axis.
| Waiting time (minutes) | Frequency |
|---|---|
Plan. Calculate each width and density, then draw touching rectangles over the actual intervals.
All widths are five minutes, so the bar heights are
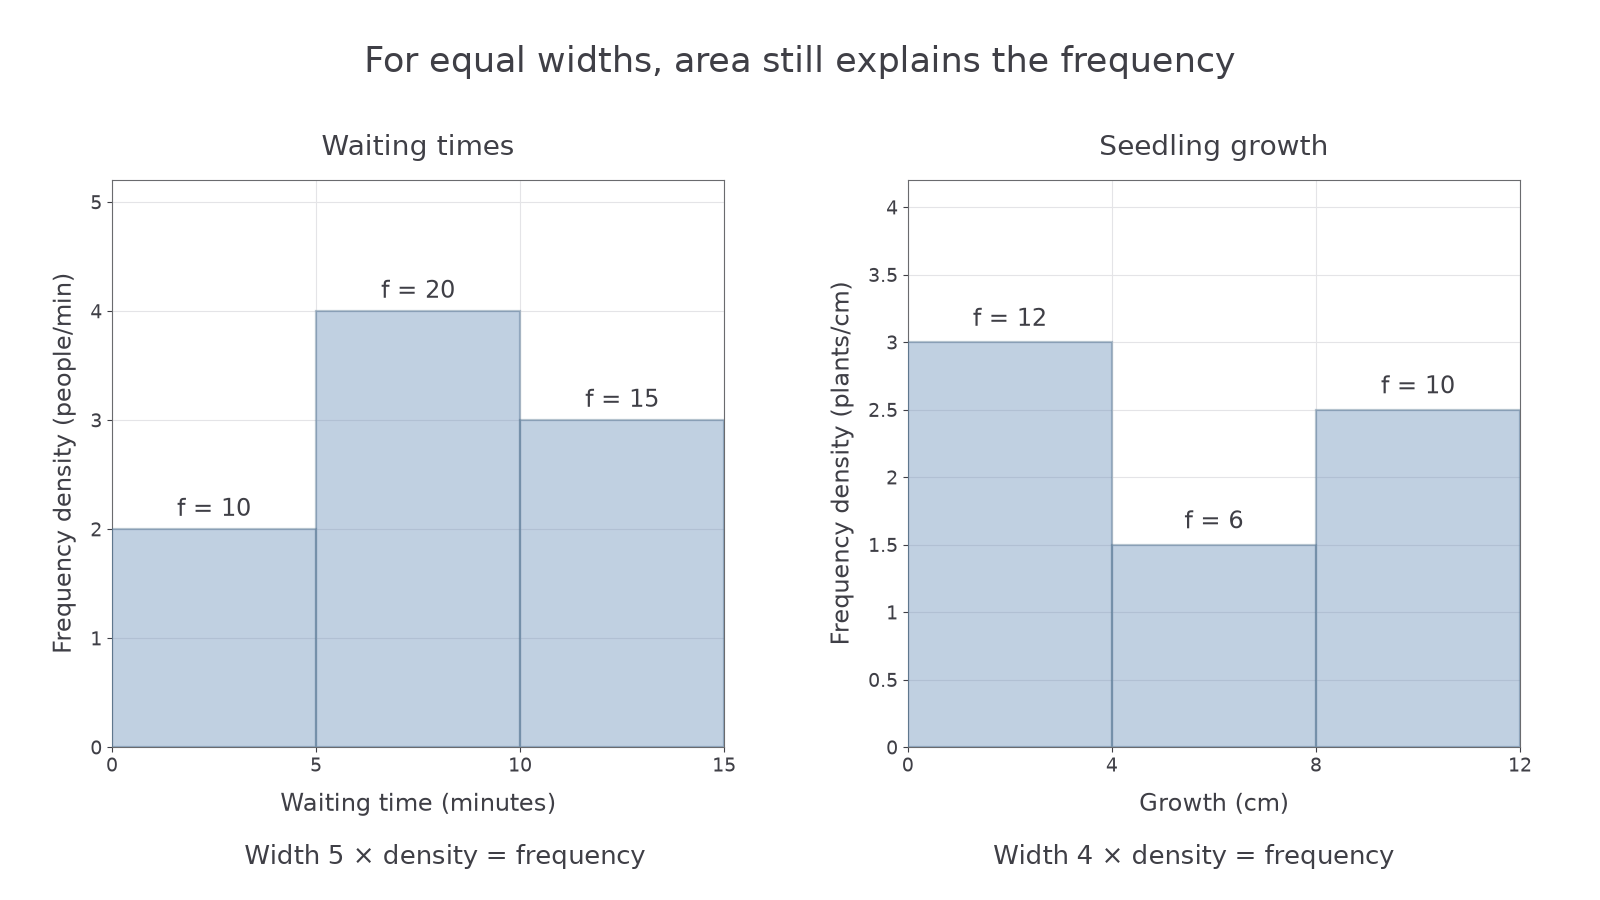
Use a uniform horizontal time scale and a vertical density scale starting at zero. The left equal-width diagram shows the resulting bars.
Answer. Heights people per minute over intervals zero–five, five–ten and ten–fifteen minutes.
Check. The areas are , , , matching every frequency and total .
Reverse the same area relationship when bar heights are already known.
Worked example 2: read frequencies from equal-width bars
Question. A histogram of seedling growth has classes , , centimetres. Their density heights are plants per centimetre. Find each frequency and the total.
Plan. Multiply every height by its four-centimetre width.
Answer. Frequencies , total plants.
Check. Dividing those counts by four recovers the three displayed heights. A density such as need not be a whole number, even though the complete class contains a whole number of plants.
The two operations undo each other: divide by width to draw the height, multiply by width to recover the count.
[DIAGRAM: asset_name: Equal-width histogram areas; asset_slug: equal-width-histograms; caption: Density is the height; multiplying by class width recovers each frequency.; description: Two exact histograms show the waiting-time classes of width five with heights 2,4,3 and growth classes of width four with heights 3,1.5,2.5. Every bar's area is labelled with its frequency.]
Watch out
Do not swap the ratio: density is frequency divided by width, not width divided by frequency. Check by multiplying the proposed height back by the width.
Read a fresh histogram from self-contained bar data.
Unequal classes
A wider class covers more of the measurement scale. Using frequency directly as height would give it extra area simply because it is wider, misrepresenting the data.
Unequal class intervals
For unequal classes, calculate density separately for each actual class width. Horizontal widths must use one consistent numerical scale. Bar area, rather than height, compares class frequencies. A taller bar shows a greater concentration per unit, which need not mean a larger total count.
Calculate the widths before choosing any heights, so each bar contributes exactly its class frequency as area.
Worked example 3: continuous data with unequal widths
Question. Construct a histogram for these journey times. Which class contains most people?
| Journey time (minutes) | Frequency | Width | Density |
|---|---|---|---|
Plan. Divide frequency by the correct width, then draw each rectangle from its own lower to upper boundary.
For example, the narrow ten–fifteen-minute class has height ; the wider fifteen–thirty-minute class has height . Use heights , with the widths shown by the horizontal scale.
Answer. The class contains most people: thirty, despite having a shorter bar than the ten–fifteen-minute class.
Check. Areas give , total . The tallest bar has area twenty-five, not the largest area.
Grouped discrete data can also be displayed with histograms. When adjacent groups use whole-number limits, first identify continuous plotting boundaries halfway between the possible integer values.
Worked example 4: integer marks and class boundaries
Question. Marks are whole numbers. Draw a histogram for classes ten–nineteen, twenty–twenty-nine and thirty–forty-nine, with frequencies .
Plan. Replace the integer class limits by adjoining halfway boundaries, then calculate widths and densities.
| Integer marks | Plotting boundaries | Width | Density (students per mark) |
|---|---|---|---|
| – | – | ||
| – | – | ||
| – | – |
The halfway numbers are plotting boundaries, not possible recorded marks. The final bar is twice as wide as the first two.
Answer. Touching bars with heights over the stated boundaries.
Check. The first group contains ten possible integers, so its width is ten, not . The last bar's area is , correctly double the first bar's area despite their equal heights.
Continue this lesson.
You’re previewing NovaLearn without an account. Create a free account to read the rest.
Create free account