FS4–FS5, HS5–HS6 - Averages from frequency tables
Calculate exact summaries from discrete frequencies, estimate a mean from grouped measurements, and distinguish an exact median or mode from a median or modal class. FS4–FS5 and HS5–HS6 connect these summaries to meaningful descriptions of distributions.
Frequency calculations
If a table has four rows, does its mean use four observations? Usually not: each frequency says how many observations that row represents.
Mean from discrete frequencies
For values with frequencies ,
The product accounts for all repetitions of value . This is a calculation method to know, not a supplied formula.
Find the mode from the greatest frequency, but report the corresponding value. For the median, use positions in the full ordered data. Running frequency totals locate those positions without writing out every repetition. The range uses the smallest and largest values actually observed.
Worked example 1: an exact discrete distribution
Question. Ten households give their number of bicycles as below. Find the mean, median, mode and range.
Plan. Add products for the mean, then use the running totals to locate the middle two of ten observations.
| Bicycles | Frequency | | Running frequency total |
|---|---|---|---|---|
| | | | |
| | | | |
| | | | |
| | | | |
| Total | | | |
The mean is . Positions through have value , so both middle positions, and , are . The largest frequency is , belonging to bicycle.
Answer. Mean bicycles, median , mode , range .
Check. Expanding gives , with total and ten values. The mean may be fractional even though each household has a whole-number count.
The middle positions can fall in different rows, and a displayed zero-frequency value is not an observation.
Worked example 2: different middle rows
Question. Find the four summaries for this distribution of books borrowed by ten pupils.
Plan. Keep the numerical values separate from their frequencies; locate positions and .
| Books | Frequency | | Running frequency total |
|---|---|---|---|---|
| | | | |
| | | | |
| | | | |
| | | | |
| | | | |
| Total | | | |
Mean . Position is ; position is , giving median . The most frequent value is .
Answer. Mean , median , mode , range books.
Check. The expanded list is . No pupil borrowed zero books, so zero must not be used as the observed minimum.
Expanding a short table provides a useful check on the products and middle positions, though it is unnecessary for a very large distribution.
Watch out
Do not average the row labels or the frequencies. Divide the total value, found from the products, by the total number of observations. Repeated values count repeatedly.
Calculate all four summaries from a fresh table.
Grouped data
Grouped measurements retain their interval frequencies but lose individual values. Nine times in an interval do not mean nine identical times.
Modal and median classes
For the equal-width groups here, the modal class is the interval with the greatest frequency. Locate the middle observation or observations using running frequency totals. If the middle observations lie in one interval, that interval is the median class. Neither class gives an exact individual mode or median.
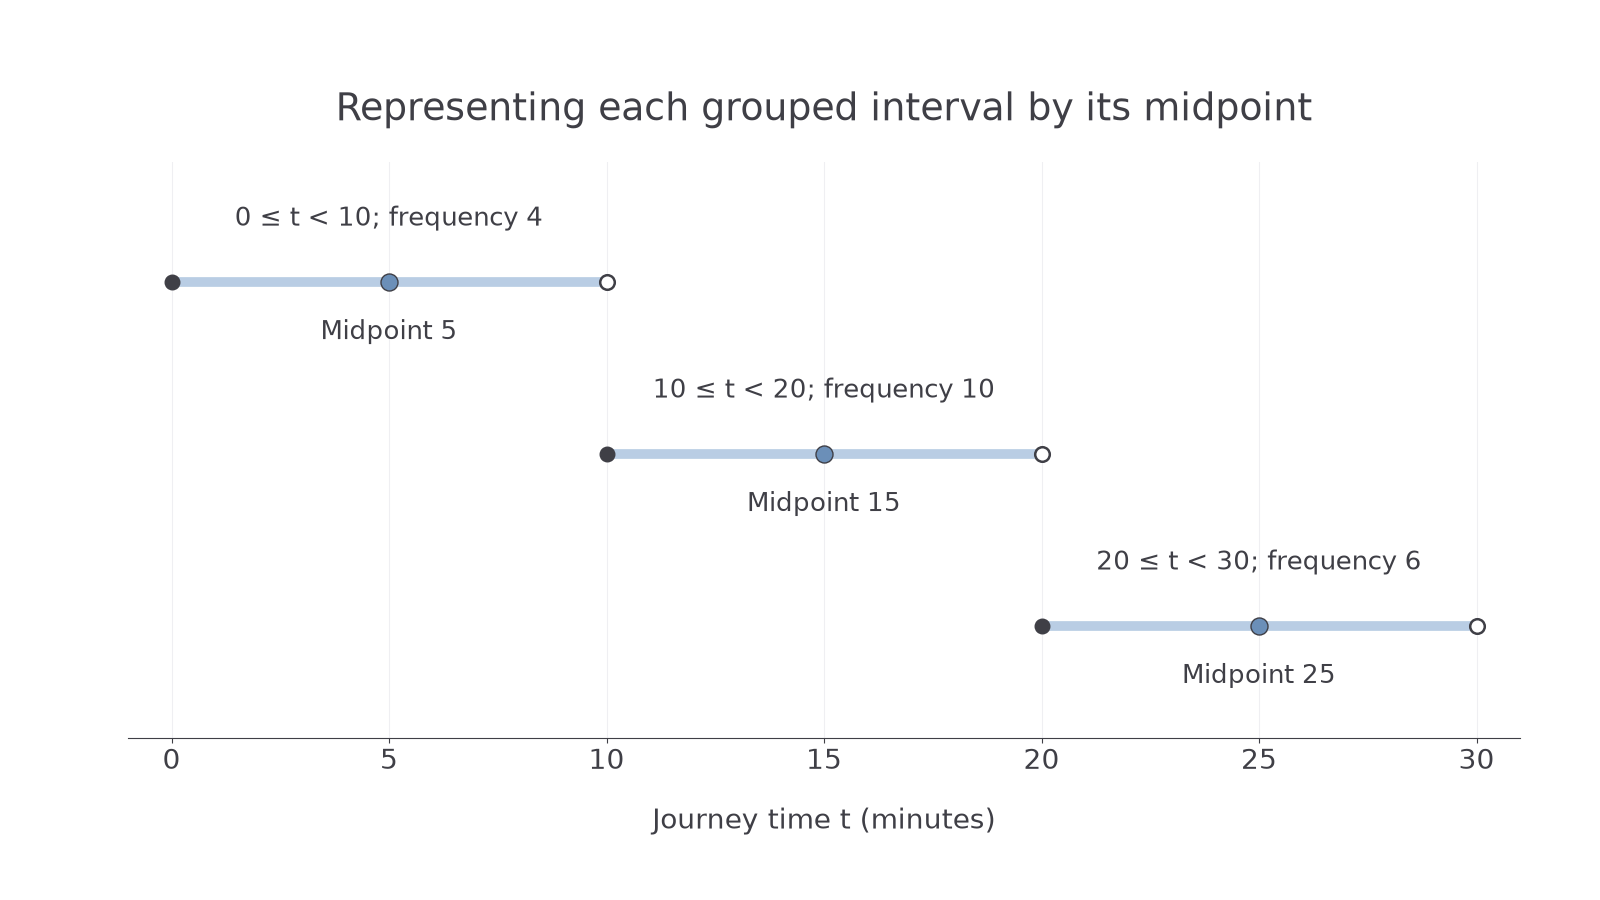
For a grouped mean estimate, represent every value in a class by the class midpoint, halfway between its boundaries. Multiply each midpoint by its frequency, add the products and divide by total frequency. This assumes that the midpoint reasonably represents the class's values; it does not prove that the values are equally spaced or all at the midpoint.
Worked example 3: grouped mean and classes
Question. Twenty journey times are grouped below. Estimate the mean and identify the modal and median classes.
Plan. Use midpoints for an estimated total, and the actual frequencies for the class positions.
| Time , minutes | Frequency | Midpoint | Product | Running frequency |
|---|---|---|---|---|
The greatest frequency is , in . The middle positions are and ; both are among positions to , in that same class.
Answer. Estimated mean minutes; modal class and median class both .
Check. Frequencies total . A midpoint-only mean would give the groups equal weight despite their different counts.
[DIAGRAM: asset_name: Grouped-time midpoints; asset_slug: grouped-midpoints; caption: Midpoints stand in for unknown times; frequencies determine how often each midpoint is used.; description: Three labelled intervals zero to ten, ten to twenty and twenty to thirty minutes have midpoint dots at five, fifteen and twenty-five. Closed left and open right boundaries match the table; frequencies four, ten and six are shown.]
Continue this lesson.
You’re previewing NovaLearn without an account. Create a free account to read the rest.
Create free account