FS3, HS3 - Tables and categorical charts
Organise categorical data in tables, read and construct bar charts and pictograms, and connect pie-chart angles with proportions and totals. FS3 and HS3 require suitable representations as well as accurate calculations.
Frequency tables
Does the biggest-looking section of a chart always represent the most people? We will need both a sensible display and its total to decide.
Variables and frequency
A variable is a characteristic recorded for each person or object. Categorical data put observations into groups, such as travel method or favourite fruit. The frequency of a category is the number of observations in it.
Some categories have a natural order, such as small, medium and large. Others, such as fruit names, do not. A number can be a label: bus route is a category, not a measurement twice as large as route .
A frequency table lists each category once. Tally each observation into exactly one row, then check that the frequencies add to the number of observations. Tally marks grouped in fives help prevent counting errors.
Worked example 1: organising a raw list
Question. Twelve pupils each choose one fruit. Their choices, in order, are apple, pear, apple, banana, pear, apple, pear, banana, apple, pear, banana, apple. Make a frequency table.
Plan. Create one row per fruit and count each of the twelve choices once.
| Fruit | Frequency |
|---|---|
| Apple | |
| Pear | |
| Banana | |
| Total |
Answer. Apple , pear , banana .
Check. , matching the raw list. Apple occurs in positions .
Record two categorical variables together in a two-way table. Each inner cell belongs to both its row category and its column category. Totals are counts of people, not extra observations.
Worked example 2: a two-way table
Question. In Year , pupils cycle, walk and use a bus. In Year , cycle, walk and use a bus. Organise the data and find how many of all the pupils walk.
Plan. Use years as rows and travel methods as columns. Add down the walking column.
| Year | Cycle | Walk | Bus | Total |
|---|---|---|---|---|
| Total |
Answer. pupils walk.
Check. Row totals give . Column totals independently give . Each pupil belongs to one year and one travel category.
Both table layouts count each pupil once; use the totals to check the organisation before drawing a chart.
Watch out
Adding the grand total to the inner cells counts everyone twice. The grand total checks the cells; it is not another group.
Complete a fresh two-way count.
Bar charts and pictograms
A categorical bar chart compares frequencies using bar lengths. Choose a uniform frequency scale starting at zero, label both axes, give a title and draw equal-width bars with gaps. The category axis contains labels, not numerical distances.
Worked example 3: constructing and reading bars
Question. A travel survey of pupils gives walk , cycle , bus , car . Describe a suitable bar chart and find how many more pupils use a bus than a car.
Plan. Choose a scale reaching the largest frequency and use each frequency as its bar height.
Label the horizontal axis “Travel method” and the vertical axis “Number of pupils”. Mark equally spaced vertical ticks . Draw separated equal-width bars at heights .
Answer. The chart below represents the data. There are more bus users than car users.
Check. The bars represent pupils. The bus bar is four times the car bar's height, matching .
[DIAGRAM: asset_name: Travel survey bar chart; asset_slug: travel-bar-chart; caption: Equal scale steps represent four pupils; separate categories have separate bars.; description: A labelled categorical bar chart shows Walk twelve, Cycle eight, Bus sixteen and Car four, with a frequency axis from zero to sixteen in steps of four.]
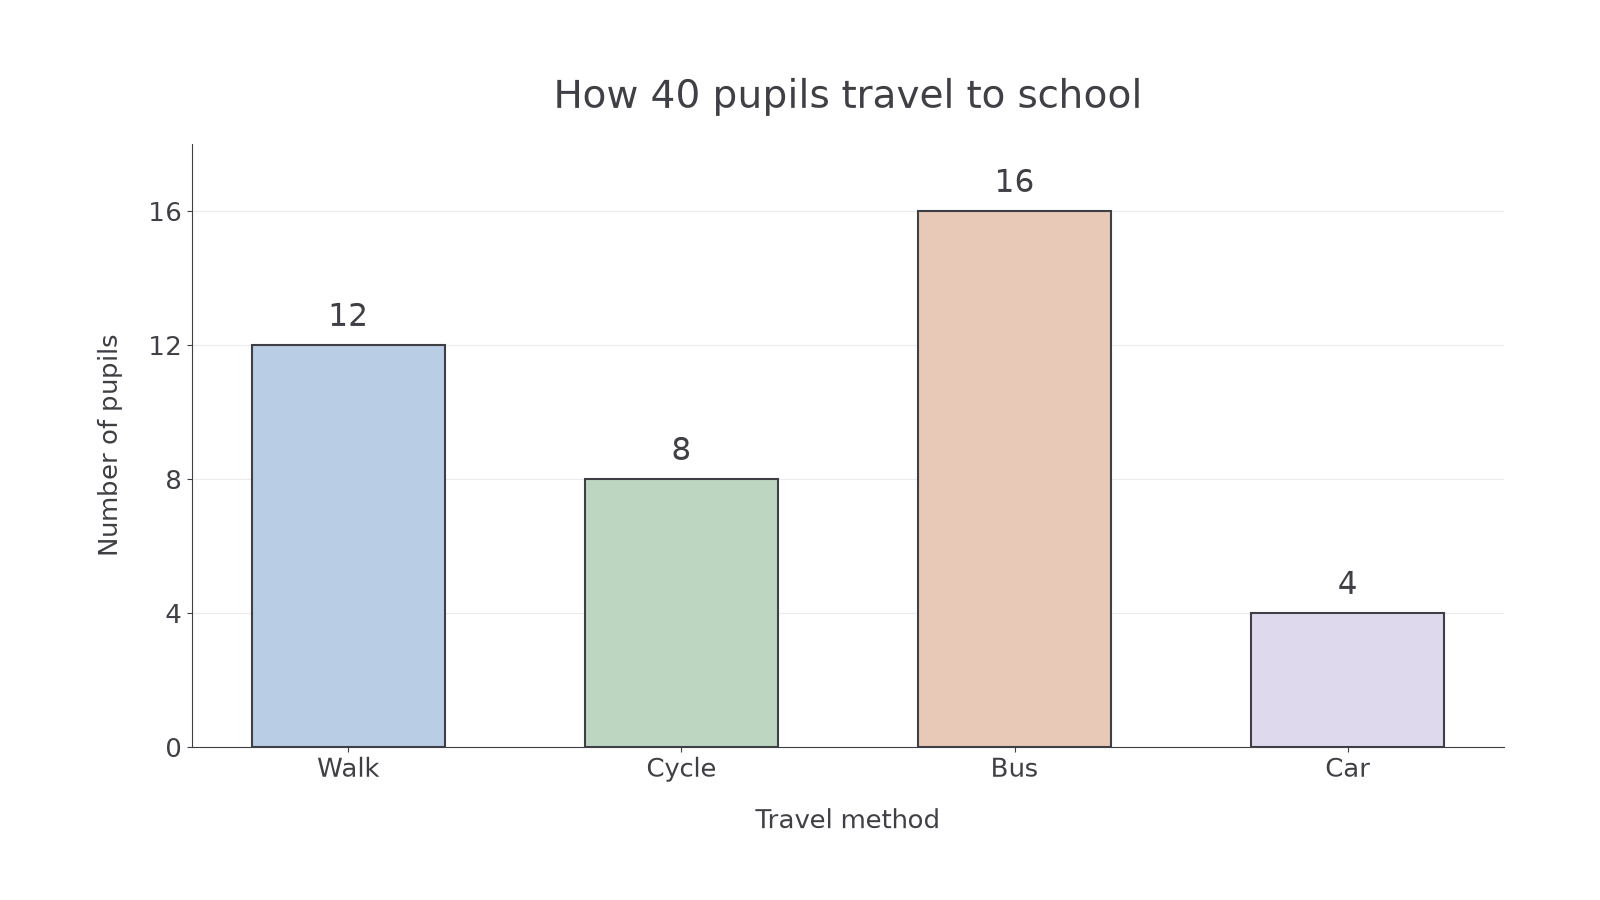
Examine the scale before interpreting a visual difference.
Worked example 4: criticising a scale
Question. A bar chart has equally spaced vertical ticks labelled . Explain the fault and give two possible repairs.
Plan. Compare the numerical change between neighbouring ticks with their equal physical spacing.
The changes are . The last equal-sized gap represents twice as many observations, so the scale is not uniform.
Answer. Relabel the equally spaced ticks , extending the axis if needed, or use . Redraw the bars to match the repaired scale.
Check. Each repaired list has a constant difference. Changing labels without checking bar heights would not repair the data representation.
A pictogram represents amounts with identical symbols. Its key states the amount for one complete symbol. Fractions of a symbol represent the same fractions of that amount.
Worked example 5: drawing fractional symbols
Question. A pictogram uses one complete circle for books. Library A lends books and Library B lends . How many symbols should each row contain?
Plan. Divide each count by the amount for one symbol.
Answer. Library A needs two full circles and a half-circle; Library B needs one full circle and a half-circle.
Check. The half-circle means books. Thus , . One full-circle difference means books.
Continue this lesson.
You’re previewing NovaLearn without an account. Create a free account to read the rest.
Create free account