HS4–HS5 - Cumulative frequency and quartiles
How can a grouped table tell you roughly how long half the journeys take, or what proportion exceed a time limit? HS4–HS5 accumulates frequencies, reads quartiles from a curve, and uses the resulting estimates to compare distributions.
Accumulating frequencies
A class frequency counts observations in that interval. A running total counts everything up to its upper boundary, including all earlier classes.
Cumulative frequency
The cumulative frequency at a value is the number of observations at or below that value, for the upper-inclusive classes used here. Add class frequencies successively. Plot each running total against its upper class boundary, beginning with zero at the first lower boundary. The final cumulative frequency is the total number of observations.
Use the measurement on the horizontal axis and cumulative frequency on the vertical axis, with labelled uniform scales. Join the points with a sensible non-decreasing curve. It cannot fall as the boundary increases, because already-counted observations cannot disappear. A curve estimates values within classes; a question may instead specify straight-line interpolation between the plotted points.
Worked example 1: continuous journey times
Question. Make a cumulative frequency table and graph for eighty journeys on Route A.
| Journey time (minutes) | Frequency | Cumulative frequency |
|---|---|---|
Plan. Keep a running total and pair it with each upper boundary, not the class midpoint.
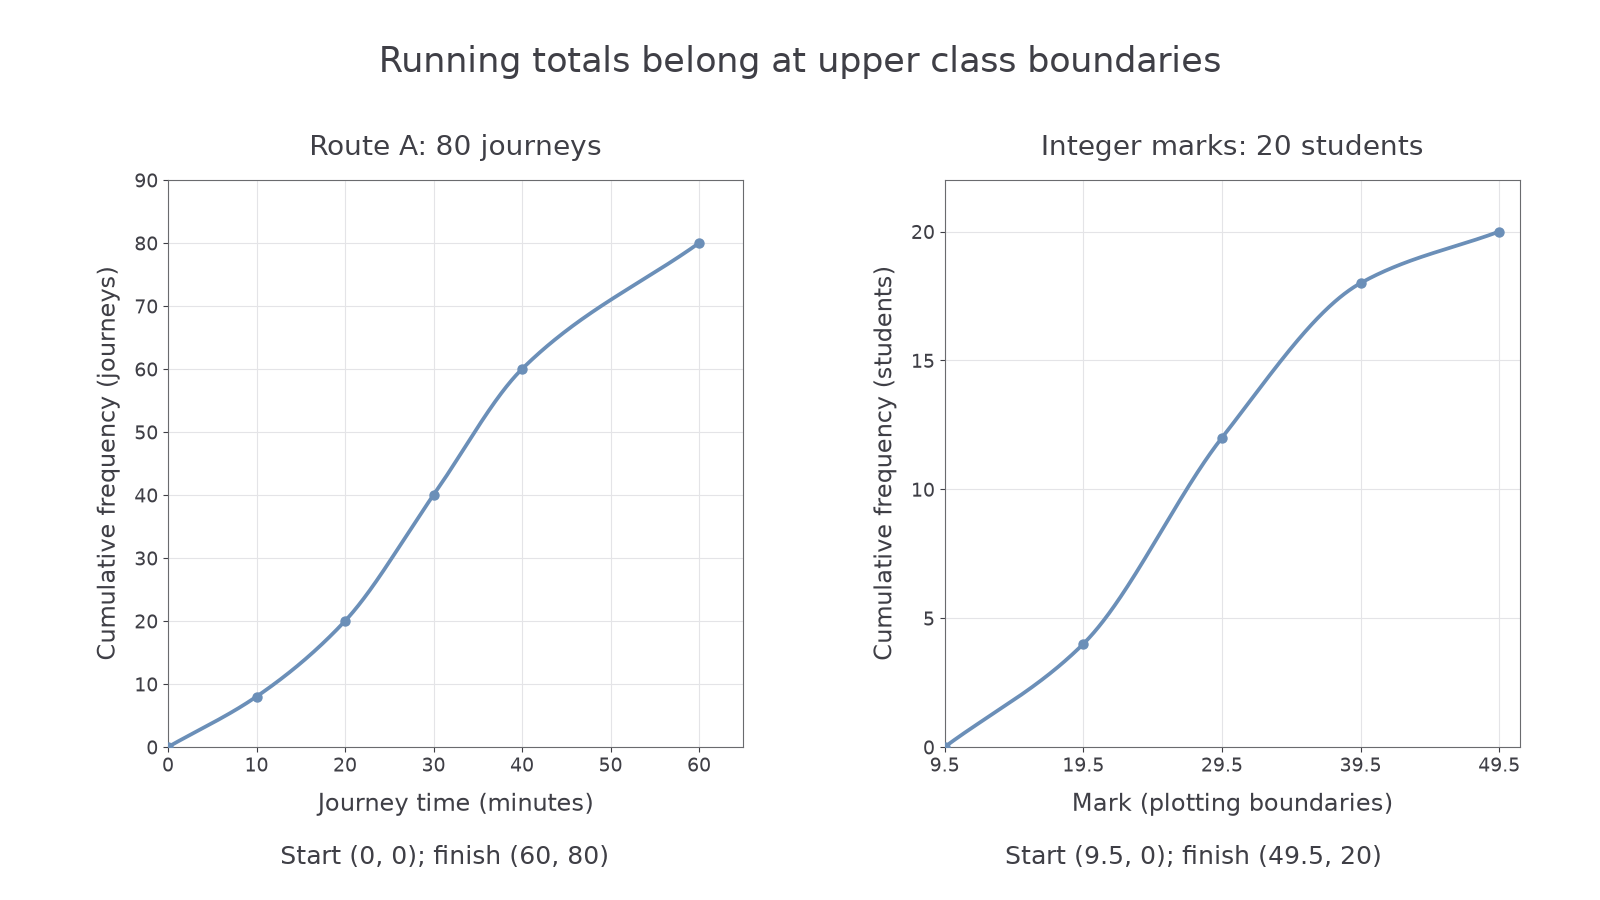
The totals are , , then . Begin at ; plot . Draw a non-decreasing curve through the points, as in the left construction diagram.
Answer. The cumulative table is shown above; the graph finishes at .
Check. Consecutive total differences recover . Their sum is eighty, matching the graph's final height. Plotting instead of would wrongly use a class midpoint.
For grouped whole-number data, a plotting boundary can lie halfway between adjacent possible recorded values.
Worked example 2: grouped integer marks
Question. Integer marks are grouped as ten–nineteen, twenty–twenty-nine, thirty–thirty-nine and forty–forty-nine, with frequencies . Give cumulative graph coordinates using continuous plotting boundaries.
Plan. Use halfway boundaries that separate adjacent integer groups, then accumulate the frequencies.
The upper boundaries are , with first lower boundary . The totals are .
Answer. Start at , then plot , and join with a non-decreasing curve.
Check. The increment from twelve to eighteen is six, recovering the third class. Halfway boundaries keep the adjacent integer groups separate; they do not claim that a student actually scored a fractional mark.
If the table already supplies boundaries such as , use them directly. The first zero-height point is a class boundary, not proof of an observed minimum; grouped data do not reveal the exact smallest or largest individual value.
[DIAGRAM: asset_name: Constructing cumulative curves; asset_slug: cumulative-frequency-construction; caption: Plot running totals at upper boundaries, with a zero starting point and no downward sections.; description: Left shows Route A's exact plotted coordinates from zero comma zero to 60 comma 80 with a non-decreasing curve. Right shows the integer-mark upper-boundary points 19.5 comma 4,29.5 comma 12,39.5 comma 18,49.5 comma 20, beginning at 9.5 comma zero.]
Watch out
A cumulative graph can stay level if a class is empty, but it cannot decrease. Check its final height against the sum of the class frequencies.
Form running totals without submitting a drawing.
Median and quartiles
To estimate a central value, begin with a fraction of the total vertical frequency, then read the corresponding measurement horizontally.
Quartiles from a grouped cumulative curve
For total frequency , estimate the lower quartile , median and upper quartile at cumulative heights , and . These divide the modelled distribution into quarters. The interquartile range, , measures the spread of the middle half of the data in the original measurement units.
Move horizontally from each cumulative height to the curve, then down to the measurement axis. The quartile is that measurement, not the cumulative height. These grouped-curve positions differ from choosing individual middle observations in an exact raw list; do not substitute a raw-list position rule for the curve's quarter-total heights.
Worked example 3: quartiles at plotted boundaries
Question. Estimate Route A's quartiles, median and IQR from its cumulative curve.
Plan. Use the total eighty to find the three vertical reading levels.
Reading across and down gives minutes, median minutes and minutes. Thus minutes.
Answer. Lower quartile about twenty minutes, median thirty minutes, upper quartile forty minutes; IQR twenty minutes.
Check. The original running totals at times twenty, thirty and forty are exactly twenty, forty and sixty, so the readings agree with the table. The quartile times are ordered around the median, and the IQR has units of minutes rather than people.
A reading inside a class depends on how the curve is drawn. When straight-line interpolation is specified, it assumes an even spread across that class and gives a reproducible proportional estimate.
Worked example 4: specified straight-line interpolation
Question. Sixty clinic waits have class boundaries minutes and class frequencies . Using straight-line interpolation between cumulative points, estimate all three quartiles and the IQR.
Plan. Form cumulative totals . Find heights fifteen, thirty and forty-five, then locate each proportionally within its class.
For , height fifteen is nine above six, out of the next class's eighteen:
For the median and upper quartile, start at twenty minutes, where the cumulative total is twenty-four:
Answer. , median , minutes; minutes.
Check. At fifteen minutes the model has accumulated . At , one quarter of the twenty-four-observation class adds six, giving thirty. At , seven eighths of that class adds twenty-one, giving forty-five. These recover the required cumulative levels independently.
Continue this lesson.
You’re previewing NovaLearn without an account. Create a free account to read the rest.
Create free account