HA12 - Exponential and trigonometric graphs
Recognise and sketch exponential, sine, cosine and tangent graphs, including negative inputs and angles beyond one turn. HA12 uses degrees for trigonometric arguments throughout.
Exponential graphs
A sequence of heights doubles every step. Should its graph be a straight line? Equal input steps multiply the output by a fixed factor, rather than adding a fixed amount, so an exponential graph bends.
An exponential function has the input in the power: , where the base is positive. For example, , and . Tables of integer inputs give useful anchors; join them with the smooth exponential shape, rather than straight segments.
Exponential graph features
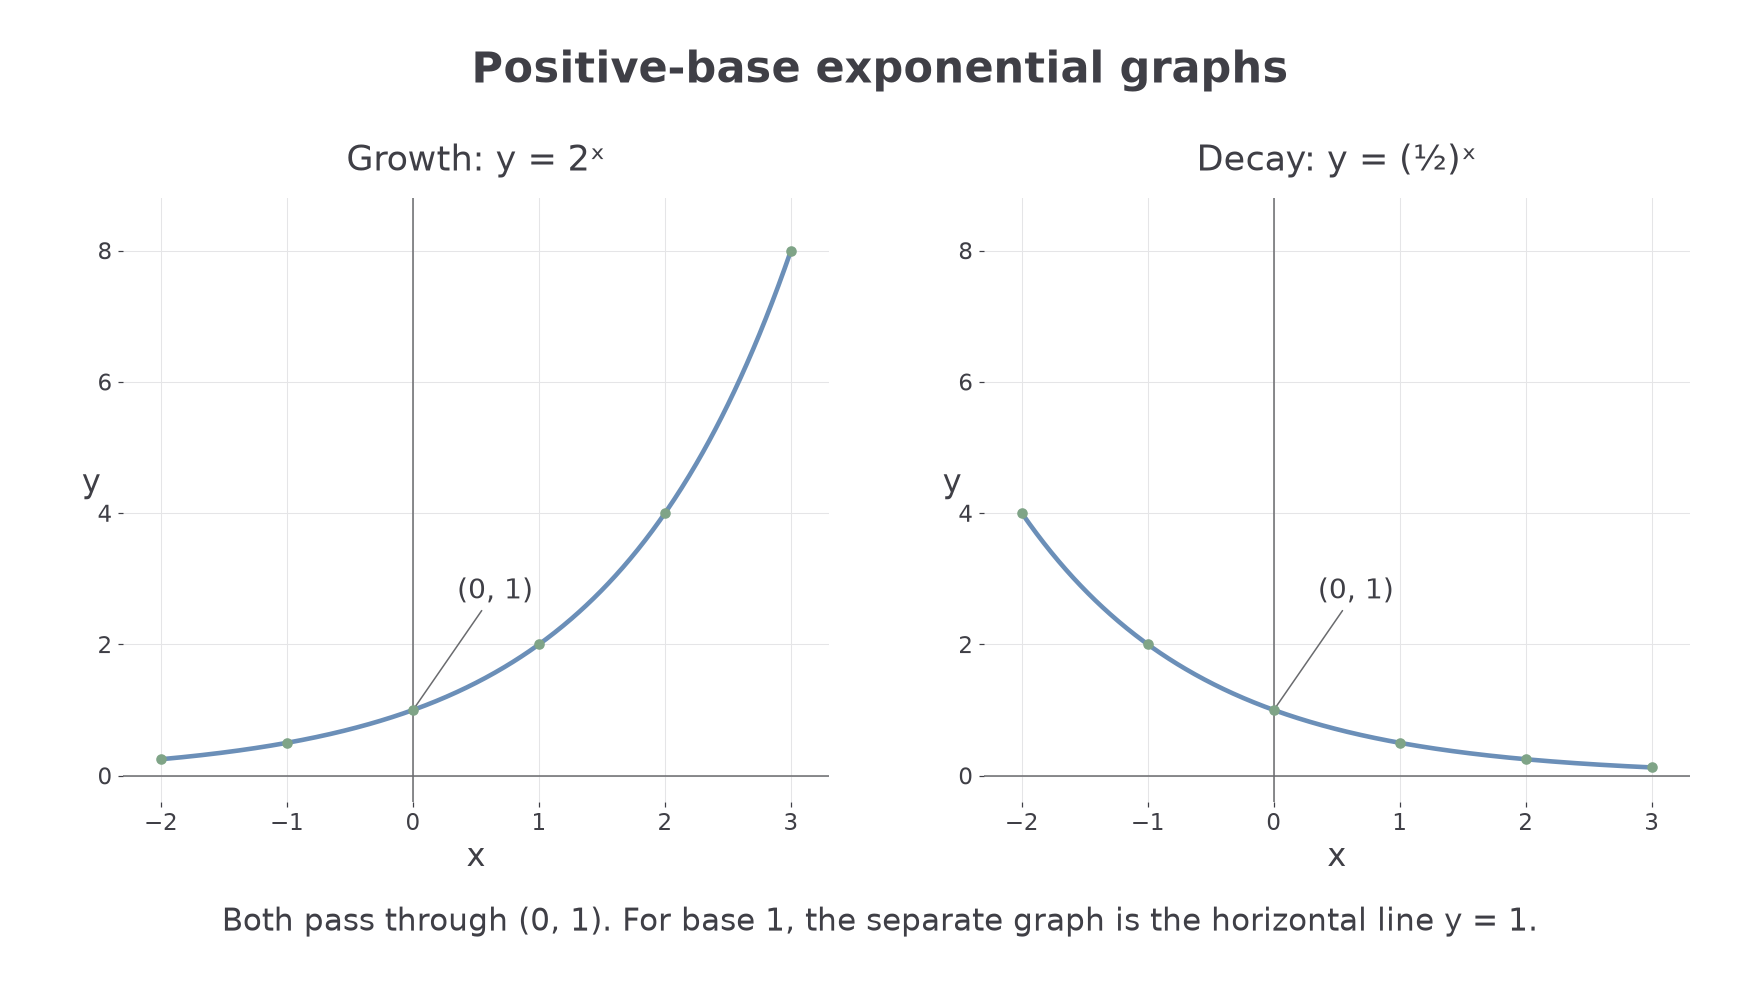
Every , with , passes through and has positive outputs for all real .
- If , the graph increases: exponential growth.
- If , it decreases: exponential decay.
- If , it is the constant graph .
For the two non-constant cases, is a horizontal asymptote: outputs approach zero in one direction but never equal it. There is no -intercept.
The base must be positive for this whole-real-input graph. For example, a negative base would not have a real value at every fractional input. The excluded base also fails at zero and negative inputs.
Worked example 1: exponential growth
Question. Sketch for , showing its intercept and behaviour towards the horizontal axis.
Plan. Calculate anchors, locate , and use the increasing exponential shape.
Draw a smooth increasing curve through these points. It crosses the vertical axis at , remains above the horizontal axis and approaches that axis as becomes very negative.
Answer. An increasing curve through the six anchors, with -intercept and asymptote .
Check. Successive outputs have ratio , while their differences are not constant. No anchor has a zero or negative output, consistent with the required shape.
Change only the base from to its reciprocal . Every step now halves the output.
Worked example 2: exponential decay
Question. Sketch over the same interval, showing its intercept and asymptotic behaviour.
Plan. Use the same input anchors and compare the outputs in order.
The curve decreases smoothly through and approaches as increases. It does not reach or cross the axis.
Answer. A decreasing positive curve through the anchors, with -intercept and asymptote .
Check. Every successive output has ratio . Also , so matching opposite inputs in the first table gives these outputs.
Both graphs stay positive even when their inputs are negative.
[DIAGRAM: asset_name: Exponential growth and decay; asset_slug: exponential-pair; caption: Changing the positive base across one changes growth to decay.; description: Exact graphs y=2 to x and y=(1/2) to x use labelled axes and integer anchors over x=-2 to3. Both cross(0,1), remain positive and approach the horizontal axis in opposite directions. A note identifies the separate constant-base-one case.]
Watch out
and are different functions. At , they give and . A negative input also does not make an exponential output negative: .
Use a fresh base and distinguish growth from decay.
Sine and cosine
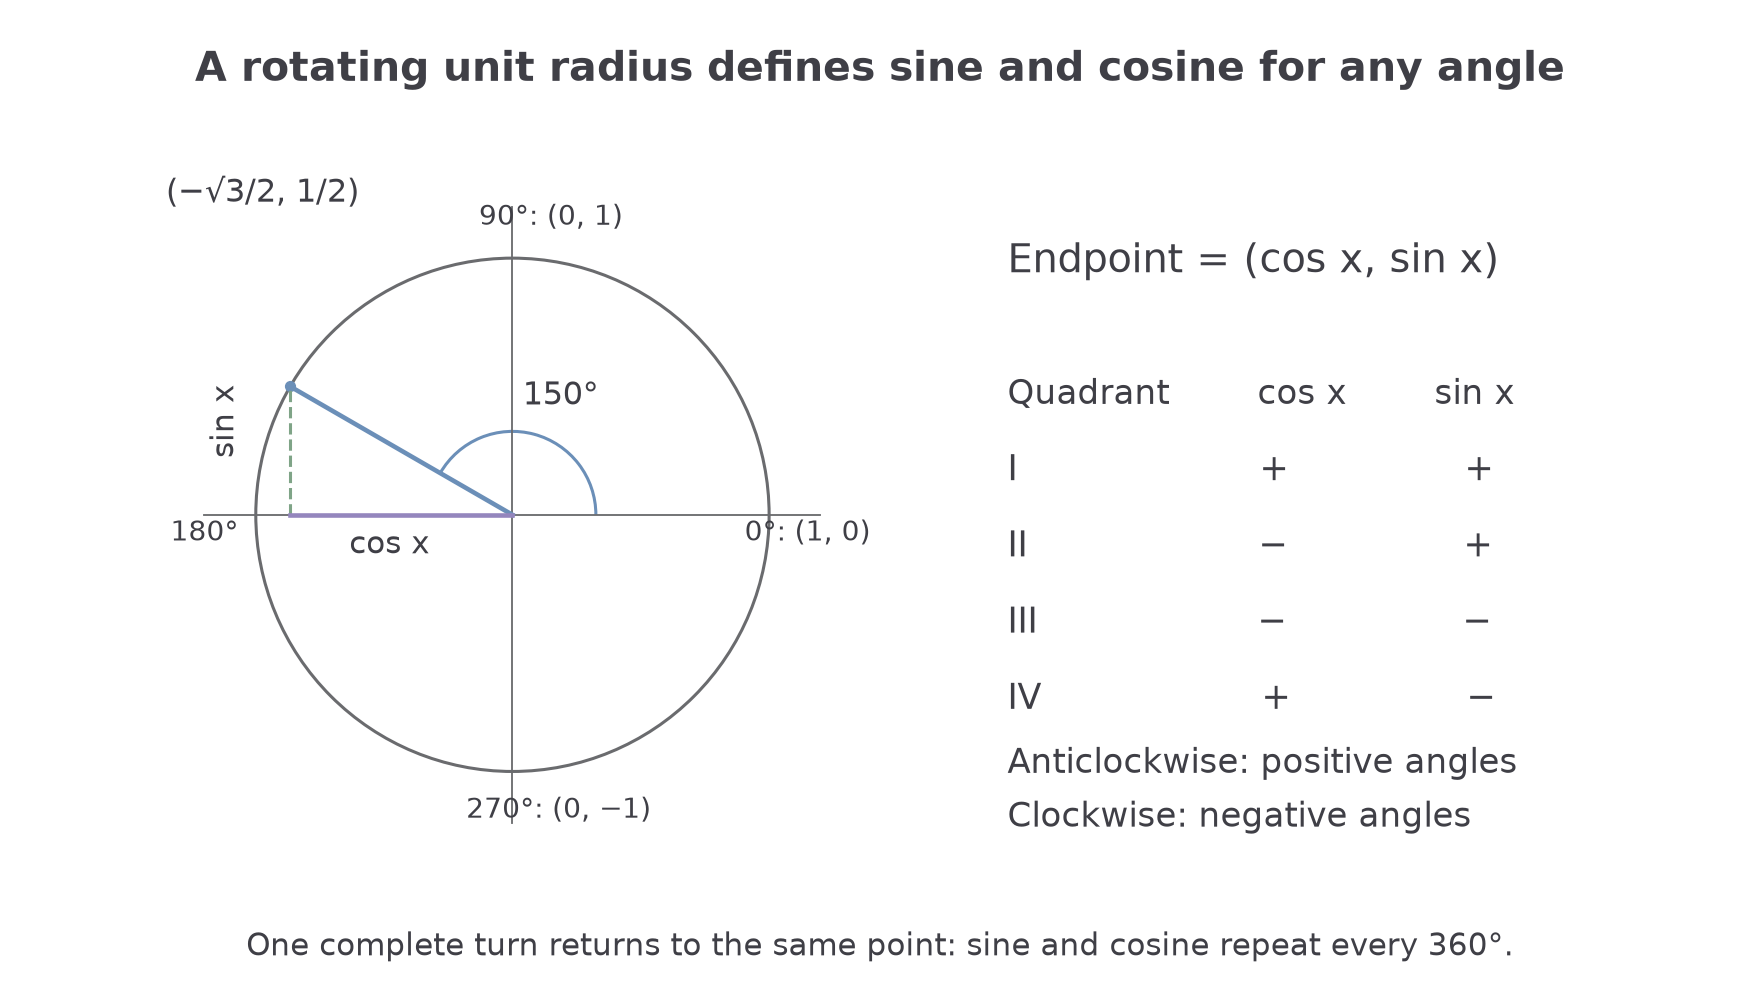
To extend acute-angle trigonometry, rotate a radius of length from the positive horizontal axis. Its endpoint is . This agrees with adjacent/hypotenuse and opposite/hypotenuse in the first quadrant and defines the signed coordinates in all four quadrants.
Anticlockwise angles are positive; clockwise angles are negative. A full turn returns to the same point, so adding or subtracting does not change sine or cosine. For example, has endpoint .
The circle coordinates explain both the signs and the repeated waves.
[DIAGRAM: asset_name: Sine and cosine around a full turn; asset_slug: full-turn-coordinates; caption: Cosine is horizontal position and sine is vertical position on the unit circle.; description: Exact unit circle shows axis endpoints at0,90,180,270 degrees and a150-degree endpoint(-sqrt3/2,1/2) with projections. Quadrant signs of sine and cosine are labelled outside the circle.]
A graph's period is the smallest positive input shift that repeats the whole pattern. The amplitude of a sine or cosine wave is the distance from its midline to a maximum. For and , period is , midline , amplitude , and output range .
| in degrees | |||||
|---|---|---|---|---|---|
Draw smooth waves through the anchors, repeating in both directions. Sine starts at zero and rises; cosine starts at its maximum. To solve a trigonometric equation graphically, draw the horizontal output level and read every intersection in the stated interval, including valid endpoints.
Worked example 3: reading the sine wave
Question. Sketch over . State and solve for .
Plan. Repeat the quadrant anchors, then use the two intersections with height .
The level meets the wave at and during the first full turn. These correspond to unit-circle points above the axis with the same vertical coordinate.
Answer. The smooth wave follows the anchors; . The equation solutions are .
Check. is coterminal with , giving vertical coordinate . Reflection of the radius across the vertical axis gives , preserving its vertical coordinate .
Continue this lesson.
You’re previewing NovaLearn without an account. Create a free account to read the rest.
Create free account