FS3–FS4, HS3, HS5 - Discrete and time-series graphs
Display numerical values in their proper order, represent observations over time and choose a display that answers the question. FS3/HS3 cover vertical-line and time-series graphs; FS4/HS5 require suitable representations for different kinds of data.
Vertical-line charts
Would a line joining “bus”, “car” and “walk” show a trend? Those are categories, so a joining line would invent an order and intermediate positions. Numerical data have a different structure.
Discrete numerical data
Discrete numerical data take separate allowed values, such as the number of pets in a household: . A count cannot be pets. Discrete values need not always be whole numbers: shoe sizes can occur in fixed half-size steps.
A vertical-line chart shows each numerical value on a horizontal number scale and its frequency as a vertical line. Label both axes, use uniform scales starting at zero on the frequency axis, and preserve numerical distances. Do not join the tops: intermediate values may not be possible.
Worked example 1: constructing vertical lines
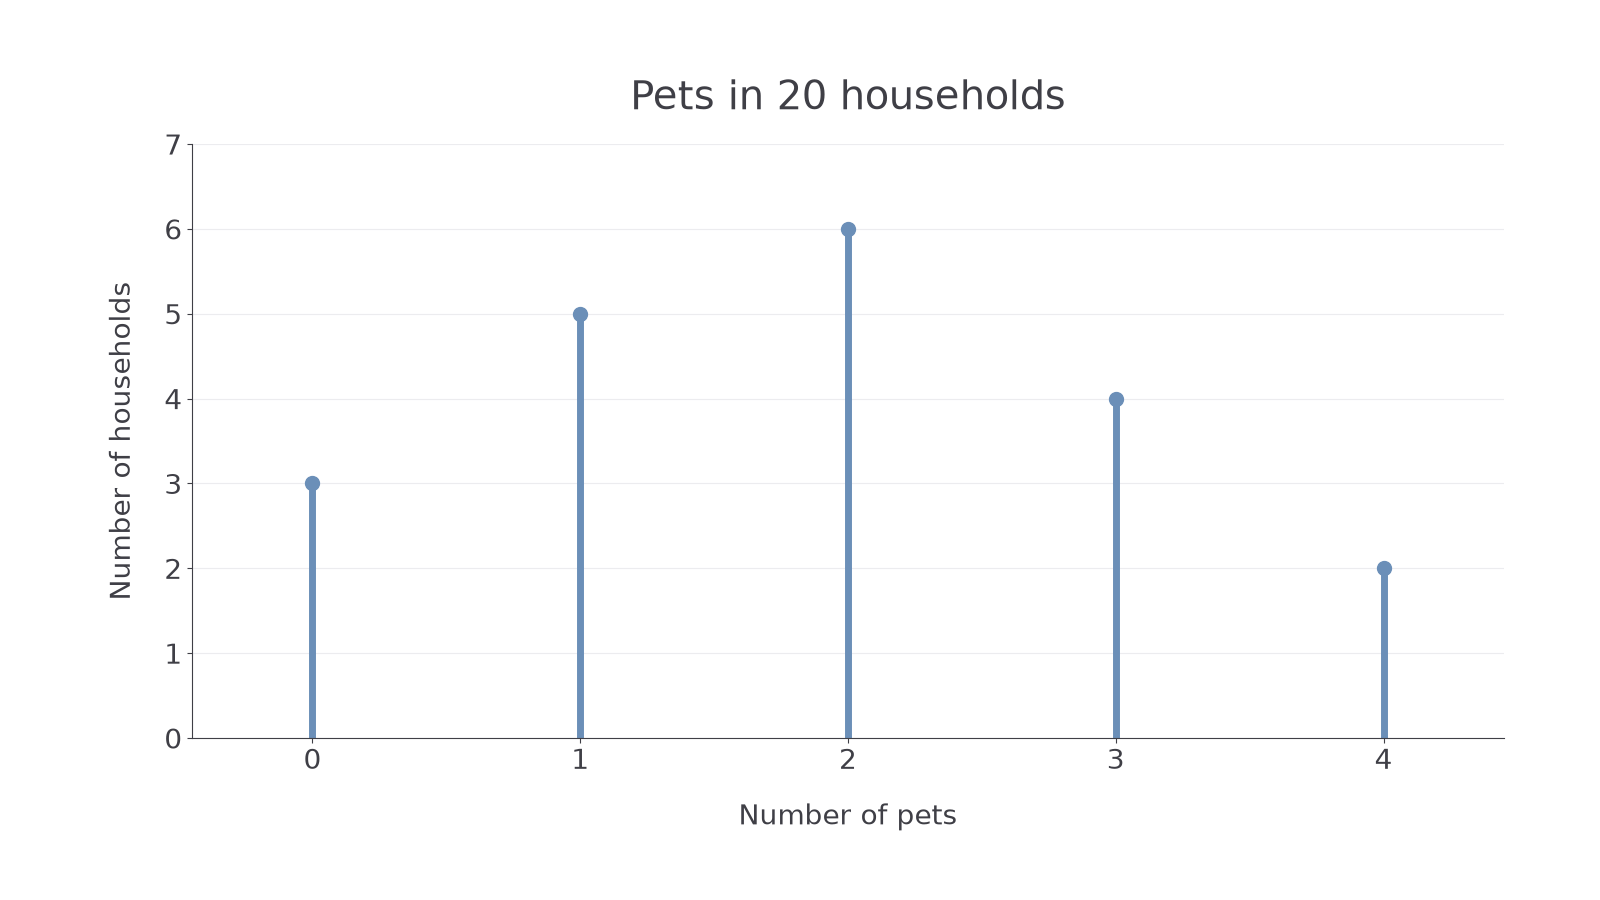
Question. Twenty households report their number of pets as follows. Describe a suitable vertical-line chart and find the number with at least pets.
| Number of pets | |||||
|---|---|---|---|---|---|
| Frequency |
Plan. Put the pet counts on the horizontal numerical axis; use household frequencies for line heights.
Draw lines at reaching heights . Label the axes “Number of pets” and “Number of households”.
Answer. The chart below displays the table. At least pets means or , so households.
Check. All frequencies total . The other households have fewer than pets.
[DIAGRAM: asset_name: Household pets vertical-line chart; asset_slug: pets-vertical-lines; caption: Horizontal positions are numerical pet counts; heights count households.; description: Vertical lines at zero, one, two, three and four pets have heights three, five, six, four and two. Uniform numerical axes are labelled.]
An unobserved value must not be squeezed out of a numerical scale.
Worked example 2: preserving numerical gaps
Question. Nine pupils borrow , or books, with respective frequencies . How should these be placed on a vertical-line chart?
Plan. Use a genuine number scale, keeping every unit interval the same width.
Mark at equal intervals. Draw a line of height at , height at and height at . Values have zero frequency, so no raised line is needed there.
Answer. The gap from to is three times the gap from to , and the lines are not equally spaced as three category labels.
Check. Frequencies account for every pupil. Equal spacing of just the three observed labels would falsely suggest equal numerical gaps.
Read a frequency at its required horizontal value before combining observations into a larger group.
Which axis is which?
The value pets is a possible observation. The frequency says how many households have that value. Interchanging them changes the meaning of the chart.
Use a fresh numerical frequency table.
Time-series graphs
A time series records a variable at successive times, such as temperature every two hours or weekly shop sales. Time belongs on the horizontal axis in chronological order; the measured quantity and its units belong on the vertical axis.
Time-series line graph
Plot each observation at its time and join successive observations with straight segments to show how the recorded quantity changes over time. Equal time intervals must occupy equal horizontal distances.
Choose a readable, uniform vertical scale. If it begins above zero, make that starting value clear: a small difference should not be described as a huge change merely because it occupies much of the picture.
Worked example 3: plotting from a table
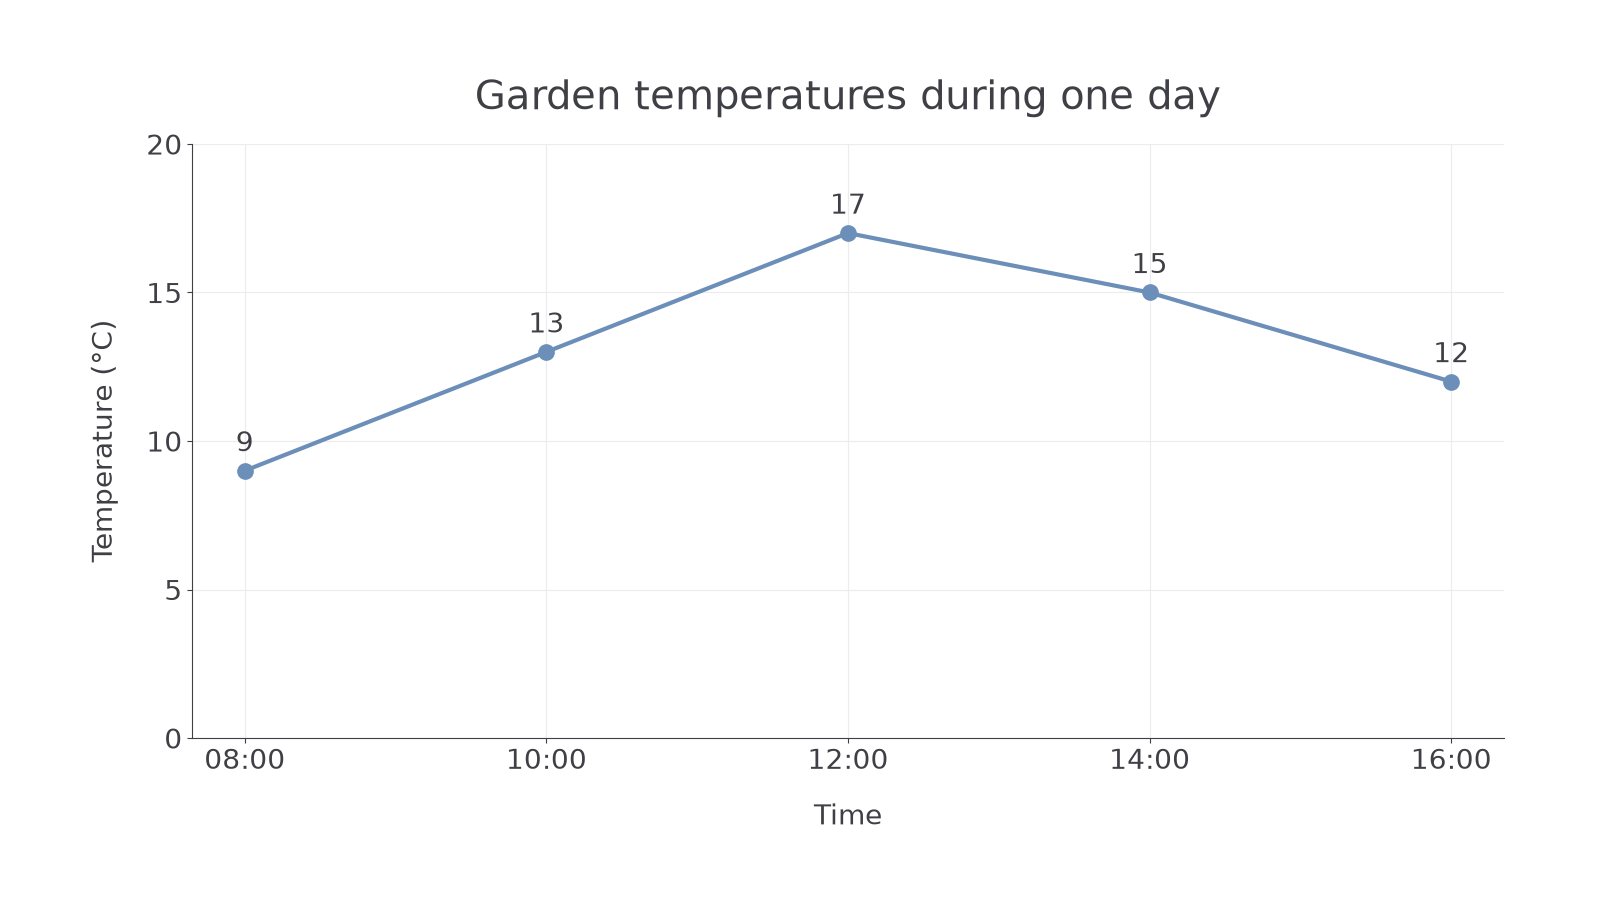
Question. A gardener records these temperatures. Construct a time-series graph and describe the changes.
| Time | |||||
|---|---|---|---|---|---|
| Temperature |
Plan. Use equally spaced two-hour positions, plot the temperature at each time and join consecutive points.
Choose a vertical scale to in steps of . Plot the five points shown below.
Answer. The recorded temperature rises from to , then falls to . The highest recorded value is at .
Check. Reading the plotted points back in time order reproduces . The overall recorded change is , although the temperature did not rise throughout.
[DIAGRAM: asset_name: Garden temperatures over time; asset_slug: garden-time-series; caption: Joined observations show recorded changes; the gaps do not contain extra measurements.; description: A time-series line graph plots nine degrees at eight, thirteen at ten, seventeen at twelve, fifteen at fourteen and twelve at sixteen hours, with correctly scaled labelled axes.]
Joining points does not turn estimates between them into measurements.
Worked example 4: unequal time intervals
Question. A room has temperatures at , at and at . Explain how to space the times and estimate the temperature at using straight segments.
Plan. Space points by elapsed time, then use the position halfway through the two-hour final interval.
The to gap is twice the to gap. is halfway from to , so its straight-line estimate is
Answer. Use horizontal gaps in the ratio ; the estimate is .
Check. is halfway between and . The actual temperature could have fluctuated between readings, so this value is not an observed fact.
The segment models the gap between readings; only its endpoint temperatures were measured.
Continue this lesson.
You’re previewing NovaLearn without an account. Create a free account to read the rest.
Create free account