HA14–HA15, HR16 - Rates and areas under graphs
Estimate gradients and areas on curved graphs, then interpret them in motion and finance. HA14 concerns real-context graphs; HA15 and HR16 connect their geometry with accumulated quantities, average rates and instantaneous rates.
Tangents and chords
A curved distance-time graph gets steeper as time passes. Does one average speed describe how fast the object is moving at every instant? An interval's average and a single instant's rate answer different questions.
A chord joins two selected points of a curve. Its gradient gives the average rate over their input interval:
A tangent follows a smooth curve's local direction at a chosen point. Its gradient gives the instantaneous rate there. For a general curve, a tangent may cross the curve or meet it again elsewhere; the local direction is what matters.
Estimating an instantaneous rate
Draw a straight tangent that matches the curve's direction at the stated point. Choose two well-separated readable points on that tangent, then calculate its rise divided by its run. The two gradient-reading points need not lie on the original curve. Use output units divided by input units.
A long gradient triangle reduces the effect of small reading errors. A line from the origin to the selected curve point is usually a chord, not its tangent. For a distance in metres and time in seconds, both average speed and instantaneous speed have units .
Worked example 1: average and instantaneous speed
Question. A distance-time curve is modelled by , for , with in metres and in seconds. Find the average speed from to , and estimate the instantaneous speed at . The drawn tangent at passes approximately through and .
Plan. Use two curve points for the interval average, but two points on the tangent for the instantaneous estimate.
Answer. Average speed ; instantaneous speed approximately .
Check. A short nearby chord from to has gradient , supporting the tangent estimate. The steeper tangent is consistent with the increasing speed.
Keep the curve and interval average, but move the chosen instant later, to a steeper point.
Worked example 2: a later instantaneous speed
Question. Estimate the instantaneous speed at on the same distance-time graph. Its tangent passes approximately through and . Compare with the earlier interval average.
Plan. Calculate the new tangent gradient without replacing its points by nearby curve points.
Answer. Approximately , greater than the average over .
Check. The short chord from to has gradient . This supports the steeper tangent estimate independently of the two large-triangle readings.
The diagrams distinguish the curve, its interval chord and the tangents at the two instants.
[DIAGRAM: asset_name: Chord and tangent rates; asset_slug: chord-tangent-rates; caption: An interval chord gives an average; a tangent gives the rate at its contact time.; description: Exact distance curve d=t squared over0to6 seconds is shown with the chord from(1,1) to(4,16) and tangent at3 through(2,3),(4,15). Second panel shows tangent at4 through(2,0),(6,32). Axes show metres and seconds; read-off points on tangents are distinct from the contact points.]
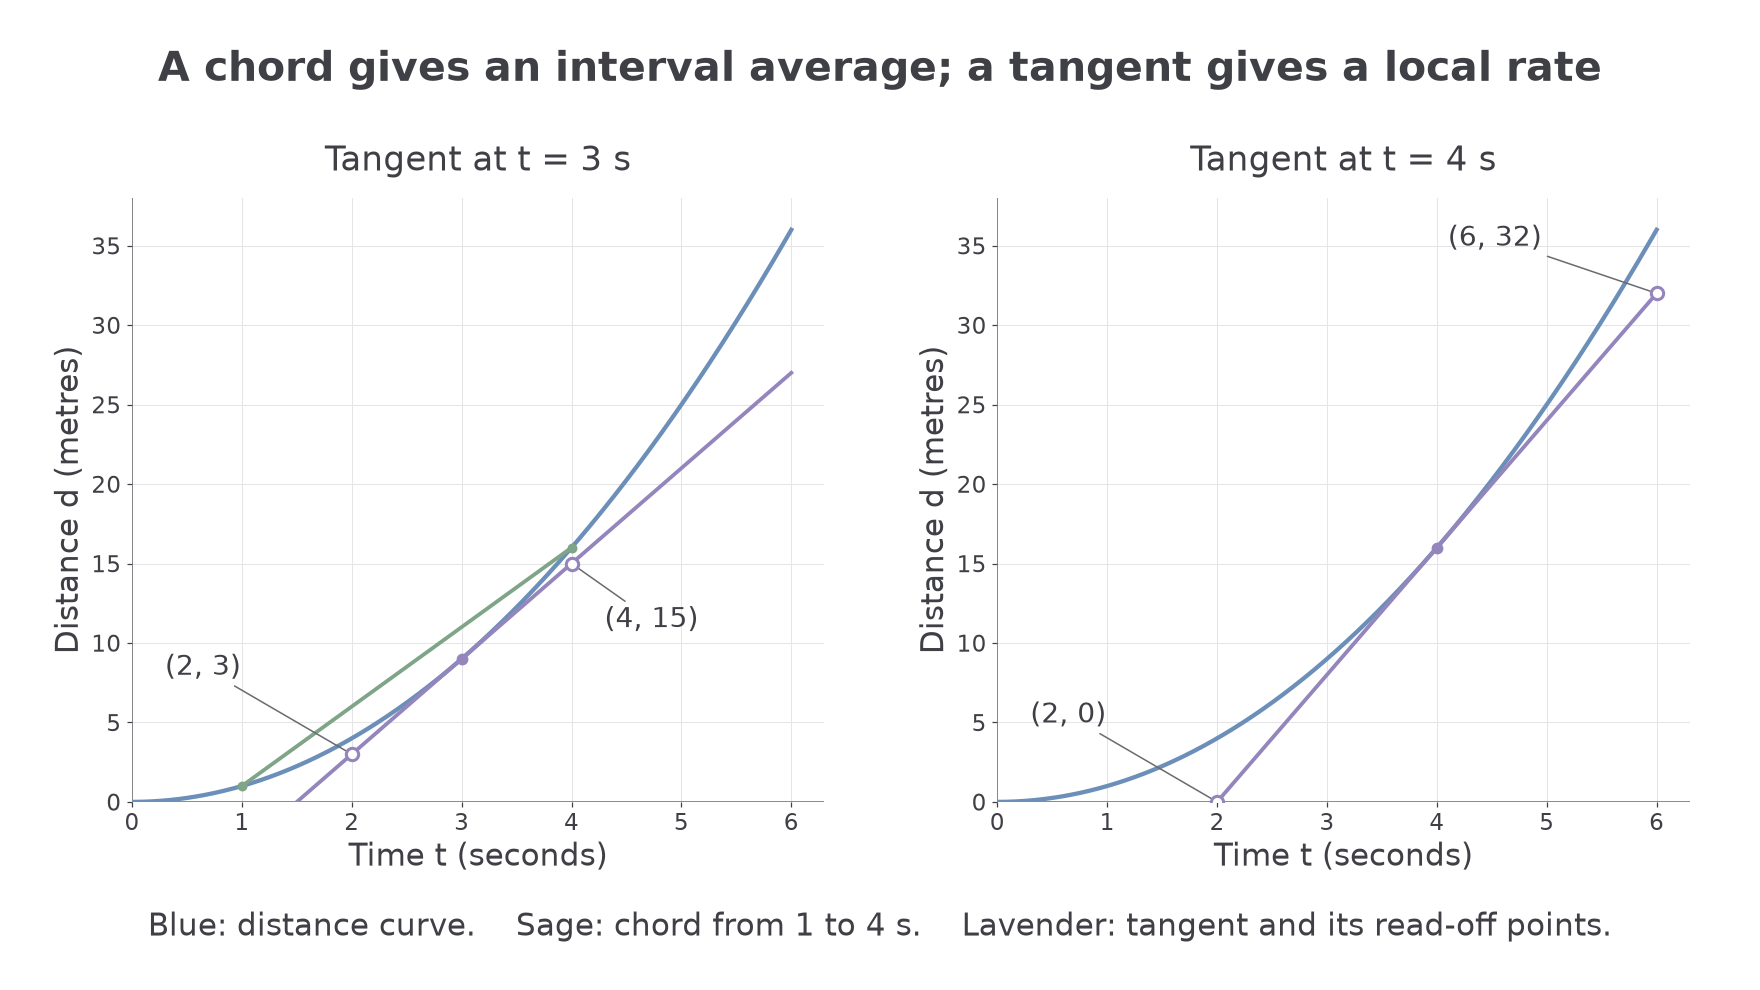
The drawn-tangent method estimates the rate: its accuracy depends on the curve, line placement and coordinate readings. A negative gradient means the output is decreasing, not that its value is necessarily negative. Keep the sign of a rate of change; a falling water level, for example, has a negative depth-time gradient.
The supplied constant-acceleration equations can also model motion when acceleration is constant; establish that condition before using them. A curved distance-time graph alone does not establish constant acceleration.
Watch out
Use the scale values on the axes, not the number of grid squares alone. A slope triangle spanning two minutes and a depth change of ten centimetres gives , not .
Distinguish a fresh interval average from a tangent estimate.
Areas under graphs
For constant speed, distance equals speed multiplied by time: the area of a rectangle under a speed-time graph. If speed varies, divide the interval into strips and add the approximate distances. This explains why an area can represent an accumulated quantity.
A straight line between two readings creates a trapezium. For width and endpoint heights , its area is
Add the separate trapezium areas. With unequal input intervals, use each strip's own width. For a curved graph these straight-edged strips generally give an estimate, even when the reading arithmetic is exact.
Area meaning and units
Graph area uses horizontal units multiplied by vertical units. A non-negative speed in multiplied by time in seconds gives distance in metres. An income rate in pounds per hour multiplied by hours gives pounds. Do not automatically label every real-context area as square metres or square units.
Here a speed curve , with seconds and metres per second, is estimated over .
Worked example 3: two trapezia
Question. Estimate the distance travelled using speed readings at , respectively.
Plan. Form two trapezia, each with width .
Answer. Approximately .
Check. Since the speed increases, left-end rectangles give and right-end rectangles give . The trapezium estimate lies between them. Its units are .
Keep the curve and time interval, but use more readings and narrower strips.
Worked example 4: four narrower trapezia
Question. Estimate the same distance using readings at times .
Plan. Use four trapezia, each of width .
Answer. Approximately , using a finer subdivision.
Check. The four left rectangles total , while the right rectangles total . Their mean is , confirming the trapezium sum by a second calculation. The smaller rectangle gap also indicates a tighter enclosure than before.
On this upward-bending curve, the joining chords lie above the curve, so both trapezium sums overestimate the actual area. The narrower strips follow the curve more closely. On a downward-bending section the chord strips lie below, giving an underestimate instead; a curve with changing curvature requires separate consideration.
[DIAGRAM: asset_name: Coarse and fine area estimates; asset_slug: trapezium-refinement; caption: Narrower strips track the same curve more closely; both sums remain estimates.; description: Exact speed curve v=t squared+2 from0to4 is compared with two width2 trapezia and four width1 trapezia. Pale fills show chord-edged areas above the upward-bending curve; totals32m and30m and the true curve are clearly distinguished.]
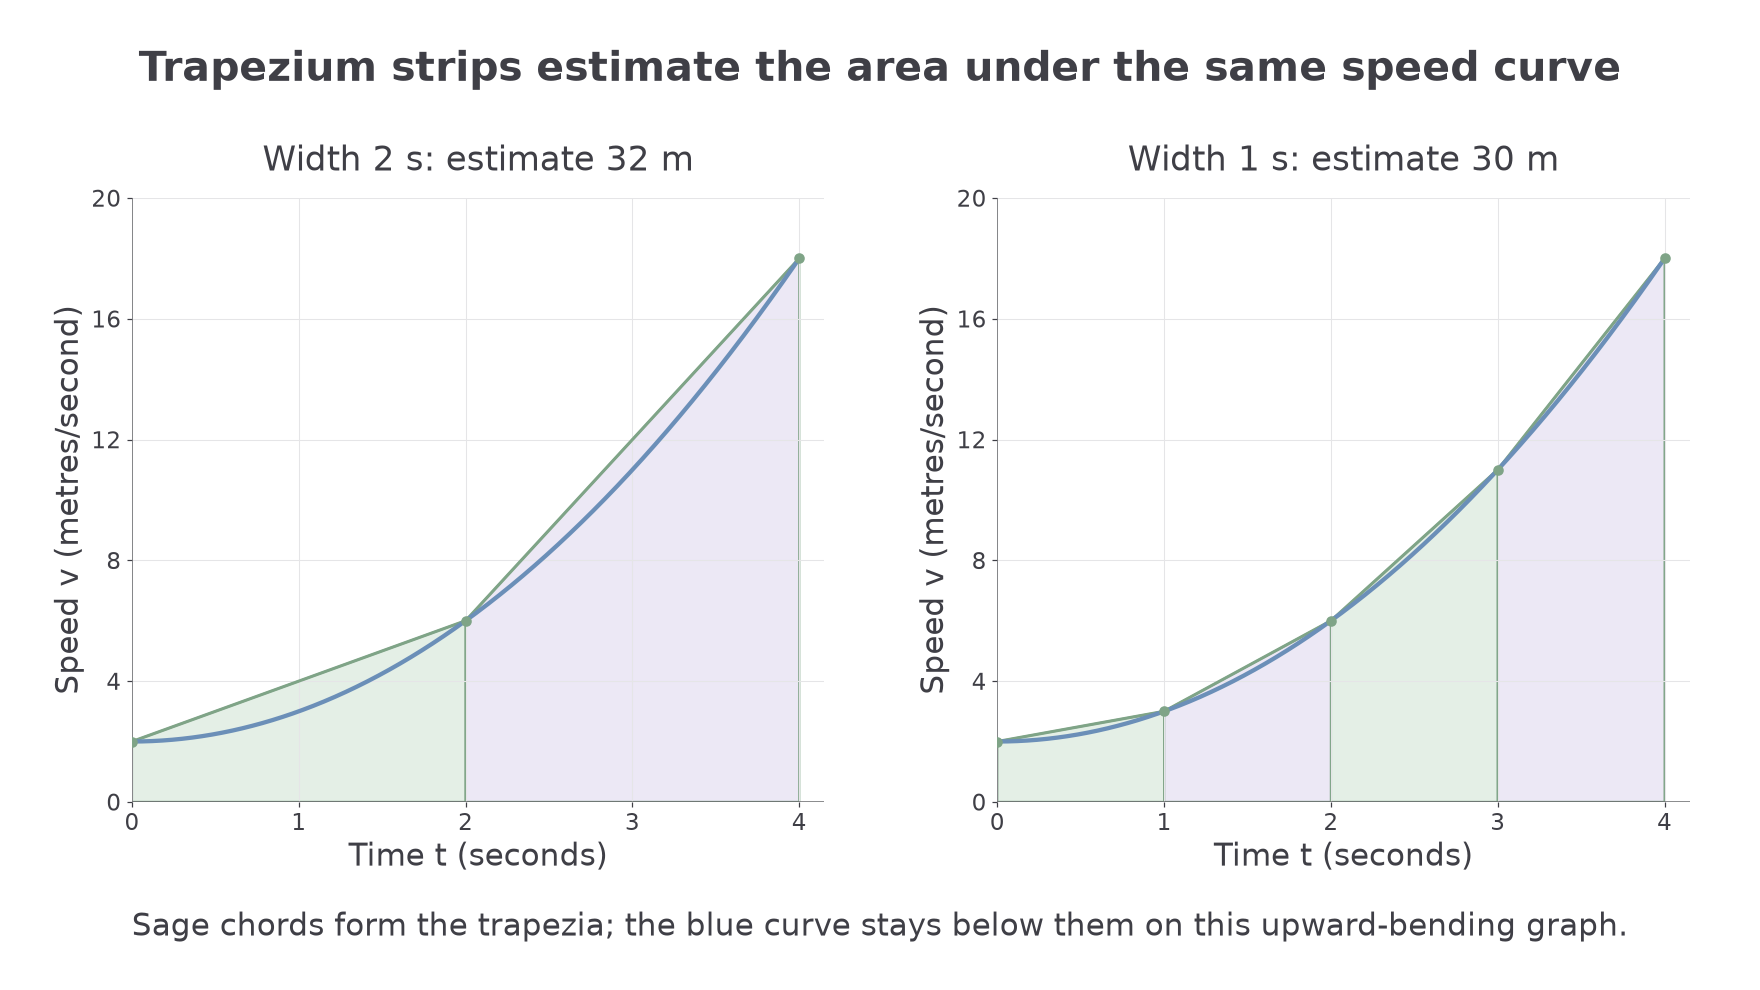
More, narrower strips usually improve an estimate for a smooth curve, but precision is still limited by the graph and readings. Use sensible reported accuracy. A finite decimal produced by the strip arithmetic does not make the curved area exact. If the graph is genuinely made of straight segments, suitable triangles, rectangles and trapezia can give its area exactly.
For a region between two graphs, use their vertical separation as the strip height. Subtract the lower ordinate from the upper at each input, then form trapezia. Equivalently, estimate both areas from the same baseline and subtract, using the same interval and subdivisions.
Continue this lesson.
You’re previewing NovaLearn without an account. Create a free account to read the rest.
Create free account