FP6–FP7, HP6–HP7 - Sample spaces and Venn diagrams
Organise possible outcomes in grids and organise overlapping groups in Venn diagrams. FP7 and HP7 use equally likely possibility spaces to calculate probabilities; FP6 and HP6 connect systematic lists, set memberships and combinations of events.
Sample spaces
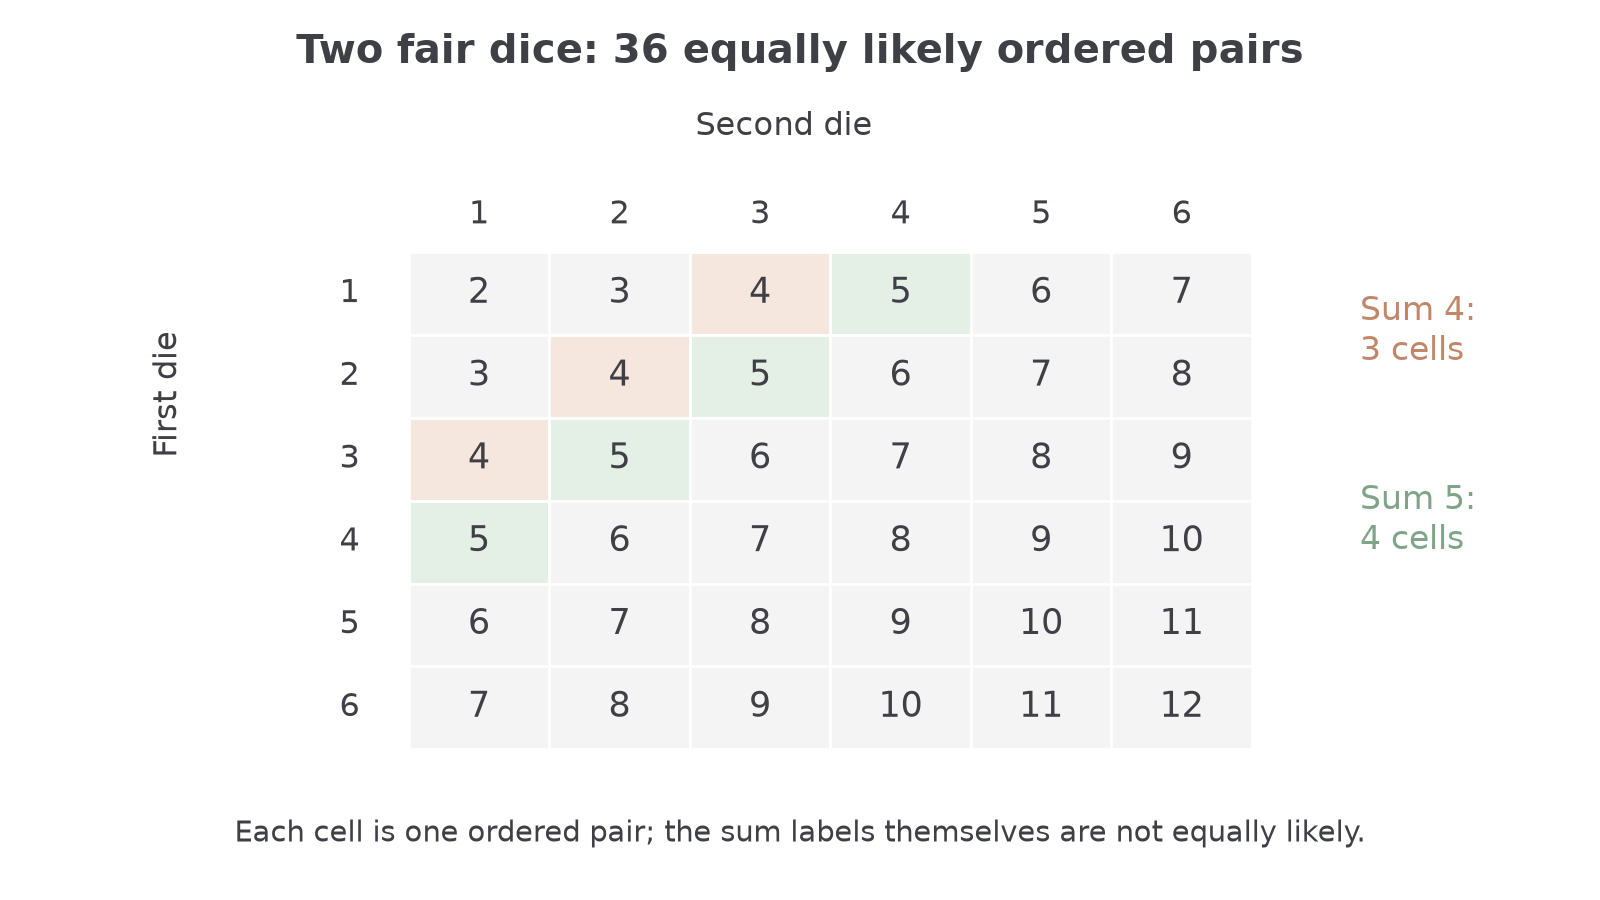
Two fair dice can produce totals from to . Are those eleven totals equally likely? A complete grid shows why counting the total labels would give the wrong answer.
Sample space
A sample space lists every possible outcome of an experiment. For one coin toss it is . For two dice, record the ordered pair of face values, such as , rather than only their sum.
For two fair six-sided dice whose rolls do not affect one another, called independent rolls, there are equally likely ordered pairs. A grid with the first die on one axis and the second on the other includes each pair once. The pair differs from , even though both total .
[DIAGRAM: asset_name: Sums from two fair dice; asset_slug: two-dice-sums; caption: Count equally likely ordered pairs rather than equally weighted sum labels.; description: A six-by-six grid has first-die values one to six as rows and second-die values one to six as columns. Each cell contains their sum. Three cells totalling four and four cells totalling five are highlighted.]
Worked example 1: counting a sum
Question. Two fair six-sided dice are rolled independently. Find the probability that the total is .
Plan. List the ordered pairs totalling and compare their count with all pairs.
Answer. .
Check. The grid has three cells labelled , one for each listed ordered pair.
Change only the target sum. A different number of ordered pairs now qualifies.
Worked example 2: a neighbouring sum
Question. Find the probability that the total of the same two dice is .
Plan. Keep the same denominator but count the pairs totalling .
Answer. .
Check. There are four highlighted -cells in the grid, so total is more likely than total .
Here “independently” means the first result does not change the second die's chances. Fairness and that unchanged-chances assumption justify treating all cells equally. If a die is biased, a complete grid still lists possibilities, but simply counting its cells does not generally calculate their probabilities.
Watch out
There are eleven different sum labels, but they are not eleven equally likely outcomes. Total comes only from ; total comes from six different ordered pairs.
Use the same systematic method for a fresh total.
Sets and Venn diagrams
A Venn diagram places each member in the region matching all its memberships. The overlapping region belongs to both sets, so it must not be entered again in either “only” region.
Set notation
A set is a collection of members. The universal set contains everyone or everything being considered.
- , the intersection, means in both and .
- , the union, means in or , including both.
- , the complement, means outside but still in .
- means the number of members in .
Start with the intersection when filling a diagram. Subtract it from each set total to obtain the two “only” regions, then use the overall total to find neither.
Worked example 3: completing two overlapping sets
Question. Of pupils, attend art, attend music and attend both. Find the numbers attending art only, music only and neither.
Plan. Place the in the overlap before finding separate regions.
Answer. Art only , music only , neither .
Check. Art total ; music total ; all regions .
The diagram shows the original seven-pupil overlap.
Continue this lesson.
You’re previewing NovaLearn without an account. Create a free account to read the rest.
Create free account