FP1–FP3, FP5, HP1–HP3, HP5 - Experiments and relative frequency
Record observed outcomes, use their proportions to estimate probabilities, and predict future counts without treating predictions as guarantees. FP1 and HP1 cover frequency tables and trees; FP2–FP3, FP5 and their Higher counterparts connect experimental results, theoretical chances and expected frequencies.
Recording experiments
If a fair coin is tossed times, must exactly results be heads? To compare what happened with what a model predicts, first record the actual outcomes accurately.
Frequency
The frequency of an outcome is the number of times it was observed. A frequency table or frequency tree records counts, not probabilities.
If a trial consists of two coin tosses, keep their order. means first heads, then tails; is a different outcome. The complete possibilities are , whether or not the coin is fair.
Worked example 1: completing a frequency table
Question. In two-toss trials, the observed frequencies are:
| Outcome | ||||
|---|---|---|---|---|
| Frequency |
Find and the number of trials starting with heads.
Plan. Use the overall total for the missing outcome, then combine the two outcomes starting with heads.
Answer. occurred times; trials started with heads.
Check. . The other trials started with tails, and .
The same observations can be organised by stages instead of complete outcome labels.
Worked example 2: completing a frequency tree
Question. Of trials, start with heads and start with tails. Within the first group, finish with heads. Within the second group, finish with heads. Find both groups' counts that finish with tails.
Plan. At each split, subtract from that branch's own parent count.
Answer. , .
Check. The children sum to each parent: , . The parents sum to the root .
[DIAGRAM: asset_name: Observed two-toss frequencies; asset_slug: observed-frequency-tree; caption: Child counts add to their own parent at each split.; description: A frequency tree starts at fifty trials, splits into first heads twenty-eight and first tails twenty-two, then into HH sixteen, HT twelve, TH ten and TT twelve.]
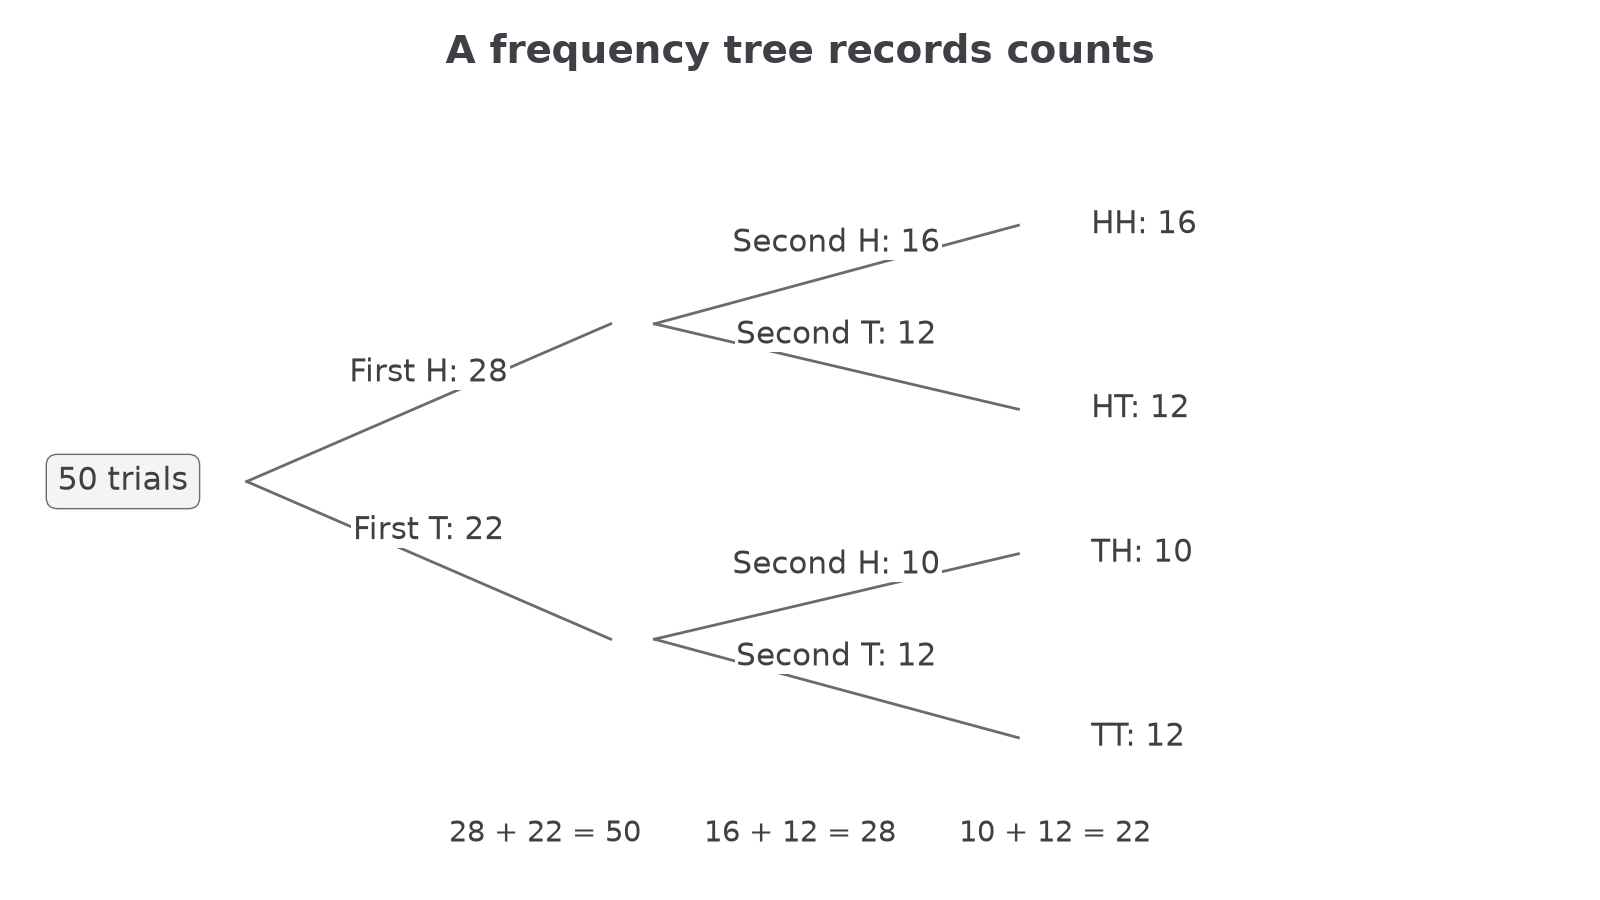
To find all trials ending in heads, combine and : . Read the stage names carefully: “first heads” and “second heads” describe different groups.
Watch out
The missing child of the -trial branch is , not . Use the total for the group being split.
Complete a fresh set of observed counts.
Relative frequency
An experiment can estimate a probability even when the device's theoretical chances are unknown. Use the proportion of trials producing the event.
Relative frequency
The relative frequency of an event is
It is an experimental proportion and can be used as an estimate of the event's probability.
Use all relevant trials conducted under the same conditions. Do not select a favourable run or assume that the number of colour labels makes a spinner fair.
Worked example 3: an experimental estimate
Question. A spinner lands on red times in spins. Estimate the probability of red.
Plan. Divide red frequency by the total number of spins.
Answer. An estimate is .
Check. , recovering the observed count. The estimate lies between and .
Extend the experiment with a different-sized batch. Combine counts before dividing.
Worked example 4: combining experiments
Question. The same spinner is spun another times under the same conditions and lands on red times. Combine this with the first reds in spins to improve the estimate.
Plan. Add event counts and trial counts separately.
Answer. .
Check. The batch proportions are and , so the combined estimate lies between them and nearer the larger batch's .
Continue this lesson.
You’re previewing NovaLearn without an account. Create a free account to read the rest.
Create free account