FA12, HA12 - Cubic and reciprocal graphs
Why does one curve pass through the origin while another approaches both axes without touching them? FA12 and HA12 cover recognising, sketching and interpreting simple cubic functions and the reciprocal function. Use calculated points, signs and allowed inputs to distinguish their shapes.
Cubic graphs
Cubing a negative number gives a negative answer: . This makes the basic cubic graph different from the U-shaped graph of .
Cubic function
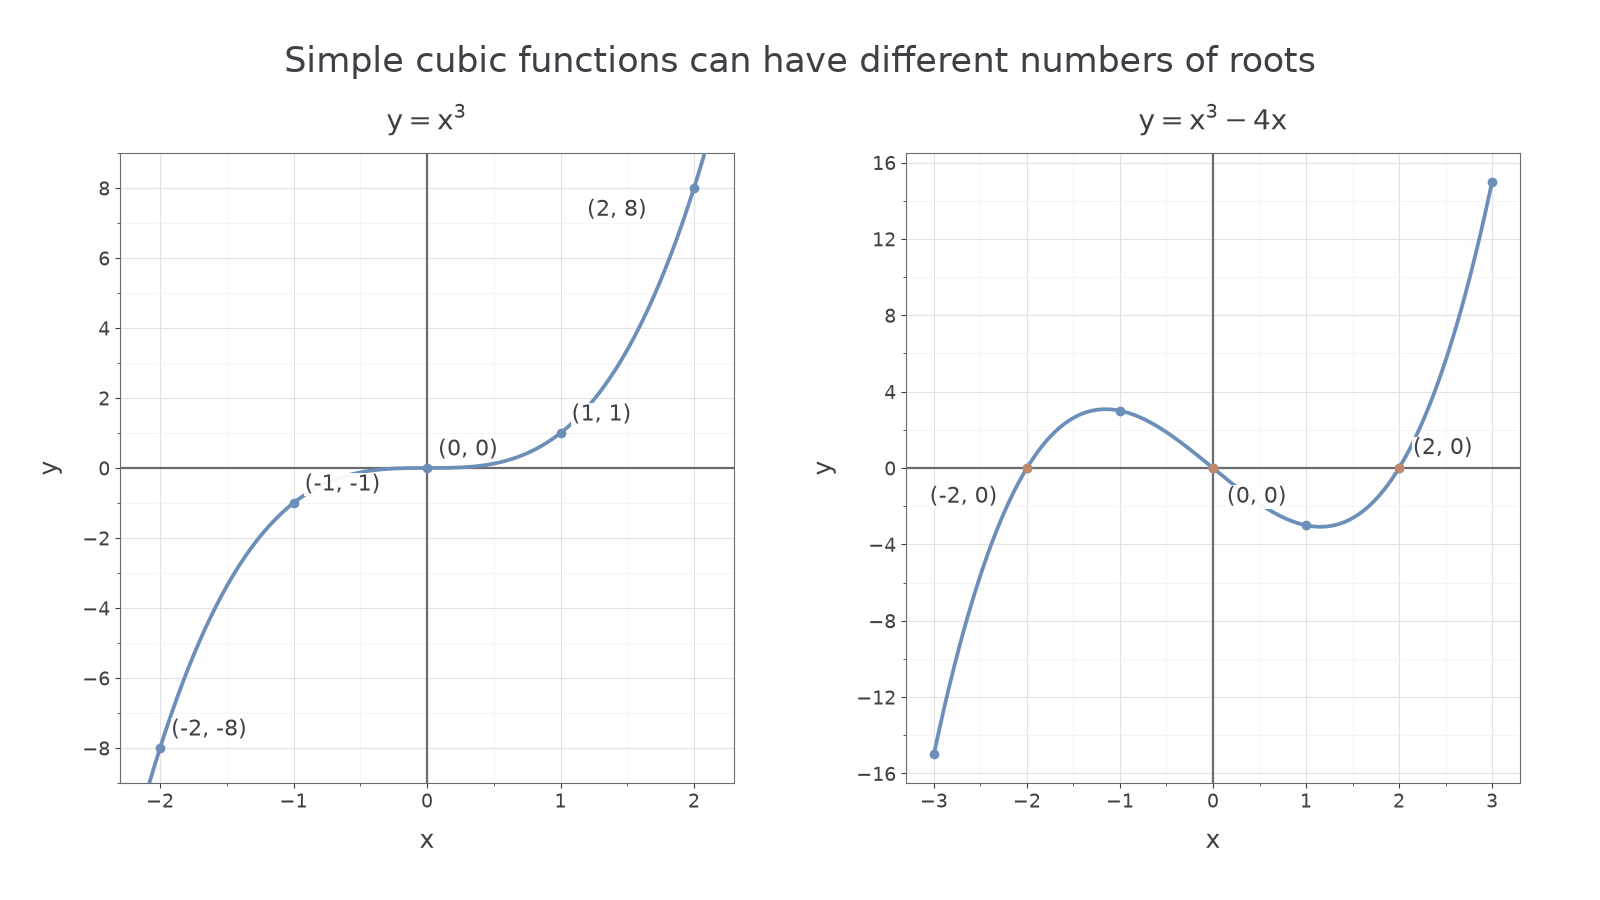
A cubic function has the form , where the coefficients are constants and . The basic cubic is defined for every real input, passes through , and increases from bottom left to top right, flattening briefly near the origin without turning back.
Plot a table and join with a smooth curve. Negative inputs cubed are negative, zero cubed is zero, and positive inputs cubed are positive. For , opposite inputs give opposite outputs; the graph has rotational symmetry of order two about the origin. A flat-looking point is not necessarily a maximum or minimum.
[DIAGRAM: asset_name: Two simple cubic graphs; asset_slug: cubic-graphs; caption: Both equations are cubic, but only the basic cube has a single x-axis crossing.; description: Scaled grids show y equals x cubed through (-2,-8), (-1,-1), (0,0), (1,1), (2,8), and y equals x cubed minus 4x through integer inputs from minus 3 to 3, with roots minus 2, 0 and 2.]
Worked example 1: the basic cubic
Question. Sketch for .
Plan. Cube each input, then draw a smooth curve through the points.
Answer. An increasing S-shaped curve through the origin, with the negative branch below the x-axis and positive branch above it.
Check. The points and correspond under a half-turn about the origin. The curve passes through the origin, not around a gap there.
Adding another term can change the number of crossings. Do not assume every cubic has the exact shape of .
Worked example 2: a cubic with three roots
Question. Sketch for , identifying its roots.
Plan. Calculate both terms for each input before subtracting.
For , .
Draw a smooth curve through the points, rising, then falling, then rising again. Add points near each bend if drawing an accurate graph; the bends need not occur at integer inputs.
Answer. The curve crosses the x-axis at .
Check. Each root makes the equation zero: for example, . The values for opposite inputs are opposites, matching the graph's half-turn symmetry.
The highest power identifies the family, but the other terms still affect the shape.
Watch out
For , writing would put a negative-input point on the wrong side of the x-axis. Three negative factors multiply to a negative result.
Use the table method on a different simple cubic.
Reciprocal graphs
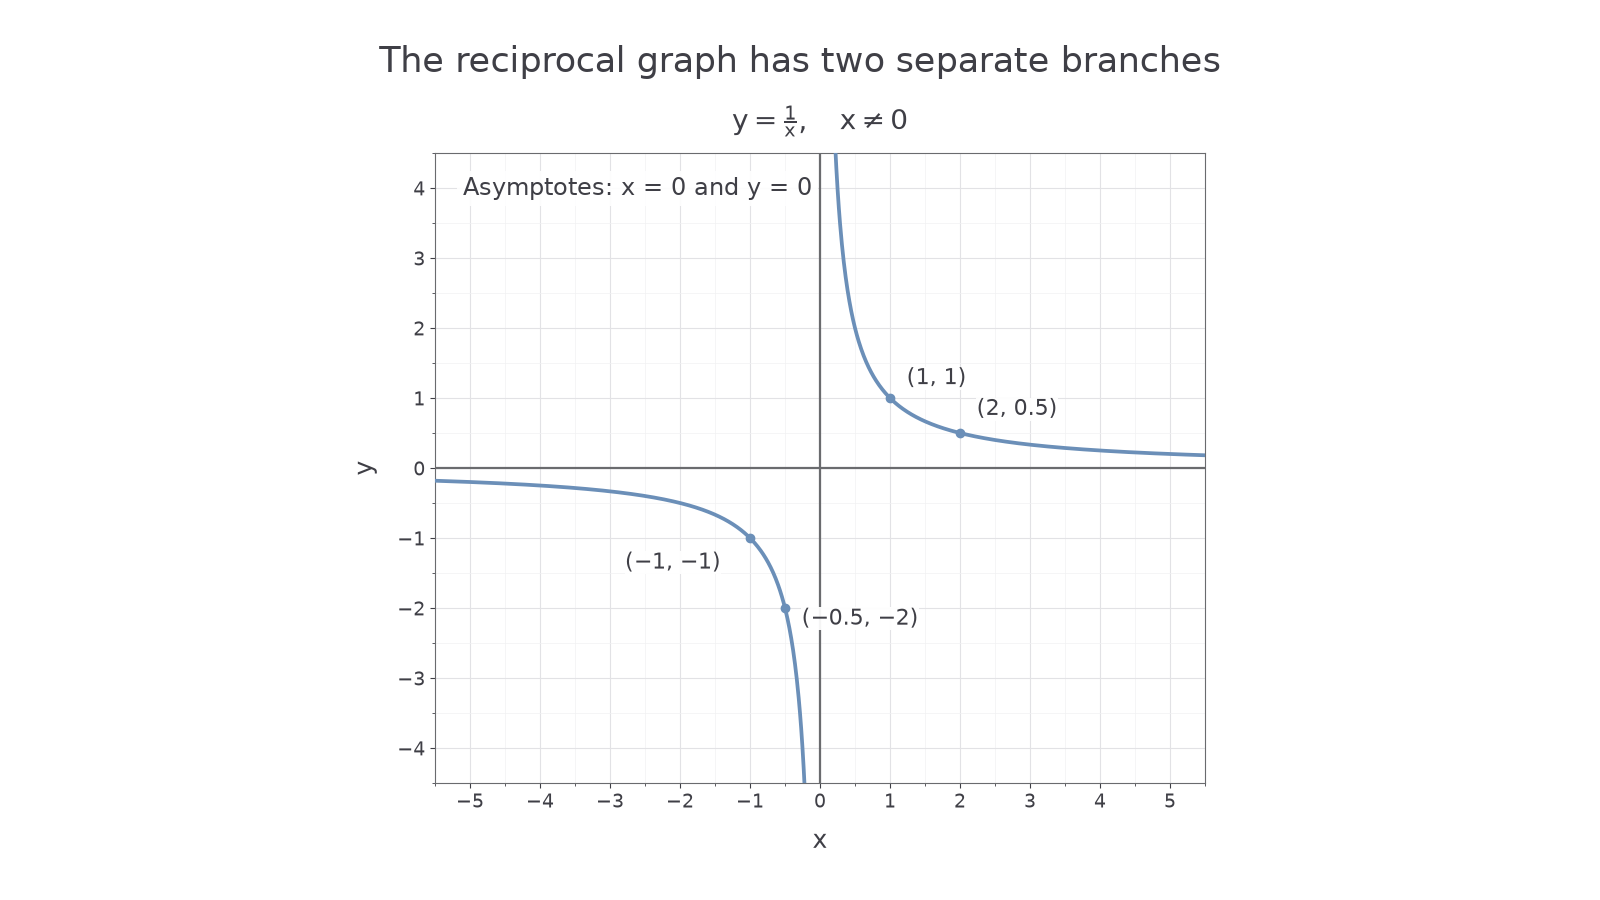
For , a very small positive input gives a very large positive output: gives . At zero the expression is undefined, so the graph must have a gap between its two branches.
Reciprocal graph and asymptotes
The reciprocal function is , with . Its graph has branches in the first and third quadrants. An asymptote is a line the graph approaches; for this function the axes and are asymptotes, and neither is crossed.
The product at every point. Thus cannot be zero, and and must have the same sign. As positive grows, shrinks towards zero; as approaches zero from the positive side, grows without bound. The negative branch behaves correspondingly in the third quadrant.
[DIAGRAM: asset_name: The reciprocal function; asset_slug: reciprocal-graph; caption: Draw the two branches separately; zero is not an allowed input or output.; description: An equally scaled coordinate grid shows y equals 1 divided by x on both sides of zero, with representative points and the coordinate axes labelled as asymptotes. No segment joins across x equals zero.]
Continue this lesson.
You’re previewing NovaLearn without an account. Create a free account to read the rest.
Create free account