FA8–FA9, HA8–HA9 - Coordinates and plotting
A coordinate pair locates a point; an equation can describe a whole line of points. FA8 and HA8 cover coordinates in all four quadrants. This part of FA9 and HA9 teaches you to calculate a table of values and draw an accurate straight-line graph, ready to study its gradient and equation later.
Four quadrants
The points and use the same two numbers. Do they name the same place? Their order tells you which direction to move, so swapping them usually changes the point.
The horizontal axis is the -axis, and the vertical axis is the -axis. They meet at the origin, . On the usual axes, positive is right and positive is up; negative values take you left or down. Read the scale before counting squares: one square need not represent one unit.
Coordinates
An ordered pair gives the horizontal coordinate first and the vertical coordinate second. A quadrant is one of the four regions between the axes. Points on an axis are not inside any quadrant.
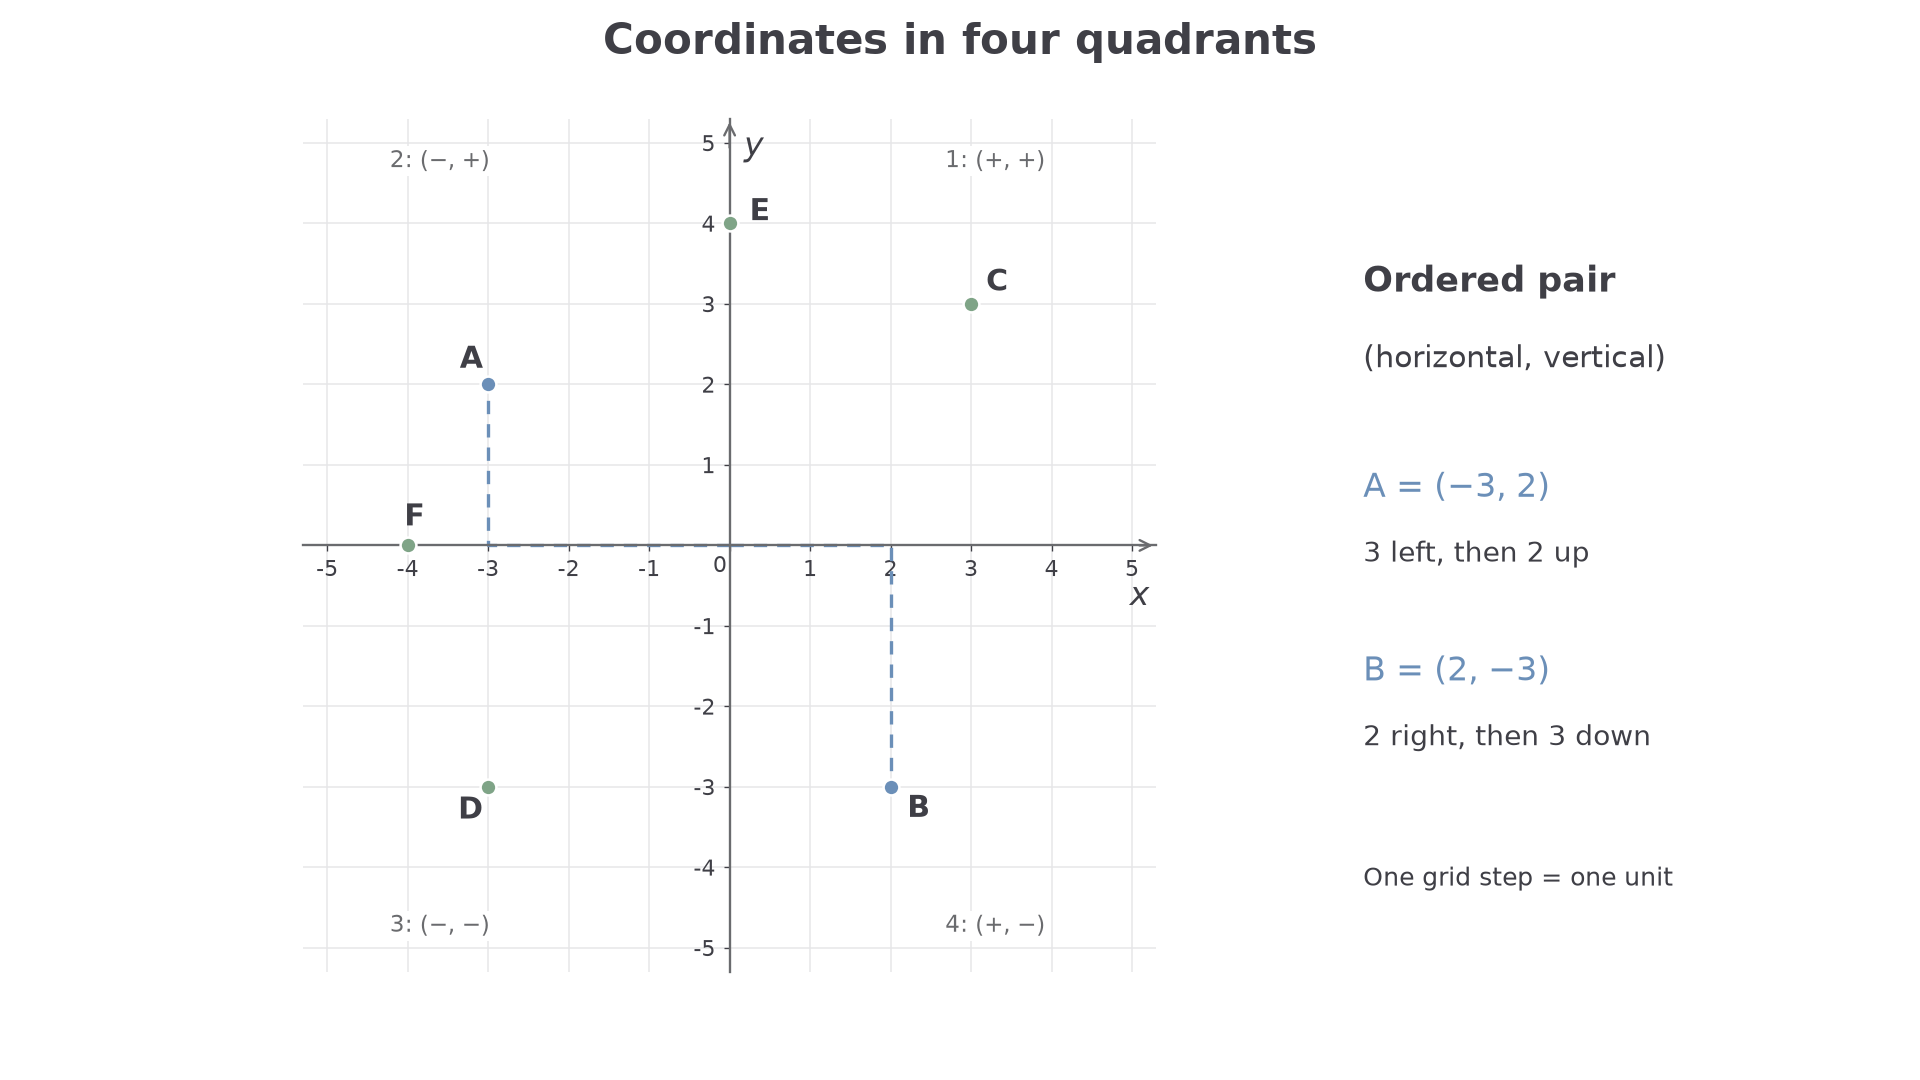
The sign pairs locate the quadrants: upper right has , upper left , lower left , and lower right . Conventionally these are quadrants , starting upper right and going anticlockwise.
[DIAGRAM: asset_name: Coordinates in four quadrants; asset_slug: coordinate-quadrants; caption: Read across first, then up or down; an axis point has one zero coordinate.; description: Unit-scale Cartesian axes from minus 5 to 5 with A at minus 3, 2; B at 2, minus 3; C at 3, 3; D at minus 3, minus 3; E at 0, 4; F at minus 4, 0. Dotted guides from the axes to A and B and sign pairs label the four quadrants.]
Worked example 1: plotting an ordered pair
Question. Plot and on axes with one unit per grid square.
Plan. Start at the origin for each point, move horizontally using the first coordinate, then vertically using the second.
For , move units left, then units up. Mark the point at the grid intersection. For , return to the origin, move units right, then units down.
Answer. is in the upper-left quadrant; is in the lower-right quadrant, at the labelled positions in the diagram.
Check. Reading back from gives horizontal coordinate and vertical coordinate . Reading from gives . The swapped pairs occupy different quadrants.
Now read points that include zero coordinates. Zero means there is no movement in that direction.
Worked example 2: reading quadrant and axis points
Question. Write down the coordinates of in the diagram.
Plan. Read each horizontal position first, then its vertical position, using the unit labels.
| Point | Horizontal position | Vertical position | Ordered pair |
|---|---|---|---|
| right | up | ||
| left | down | ||
| no horizontal movement | up | ||
| left | no vertical movement |
Answer. , , , .
Check. lies on the vertical axis, so its -coordinate is zero. lies on the horizontal axis, so its -coordinate is zero. The two non-axis points have the signs expected in their quadrants.
Brackets and a comma keep the two coordinates together; is one point, not an interval of values.
Watch out
A point on the -axis has , not . For example, is units above the origin; is units to its right.
Describe points without needing a drawing tool.
Tables of values
A table gives several coordinate pairs that satisfy an equation. Calculate the -value separately for each chosen -value.
For , the rule says “multiply by , then add ”. When , use the signed number: . Do not change into . When , the multiplication gives zero before the constant is added.
Table of values
A table of values matches each selected -value to the -value calculated from the equation. Each column supplies one point . The graph consists of all points satisfying the equation, not just those listed in the table.
You already know how to substitute into an expression. The table keeps several substitutions in a consistent order so that their results can be plotted.
Worked example 3: a positive coefficient
Question. Complete a table for , using .
Plan. Multiply each -value by , then add .
Answer.
Check. Every increase of in increases by , as doubling predicts. Also the pair satisfies .
Change the coefficient of to negative, keeping the constant the same. The -values now decrease as increases.
Continue this lesson.
You’re previewing NovaLearn without an account. Create a free account to read the rest.
Create free account