6.2 - Spread, quartiles and interquartile range
An average describes a centre but does not tell you how much observations vary. Calculate quartiles and interquartile range from discrete data, then compare spread and explain the effect of an extreme value.
What spread measures (Higher)
Can changing the largest value from to leave a measure of spread unchanged? It depends on which part of the data that measure describes.
You already know
Order observations to find a median. The range is largest minus smallest; it has the same unit as the data. A range of zero means every observation is equal.
A median locates the middle, but it does not tell you whether observations cluster close to it. Spread adds this missing information.
Measure of spread
A number describing how much observations vary. Range describes the full span; interquartile range describes the span of the central part of the ordered data.
For repeated measurements, a smaller spread can indicate more consistency by that measure. It does not automatically mean a lower average or a better outcome.
Worked example 1: equal centres, different spreads
Question. Compare the medians and ranges of A: and B: .
Plan. Locate each middle value, then subtract each pair of endpoints.
Why calculate both centre and spread? The equal medians hide the much wider spacing in B.
Answer. Both medians are ; A has less spread by range, compared with .
[DIAGRAM: asset_slug: m091_spread; caption: Two five-value datasets have the same median but different ranges; description: A has values eight to twelve close to median ten, while B has zero five ten fifteen twenty spread across a larger interval; file: m091_spread.png; recommended_method: matplotlib]
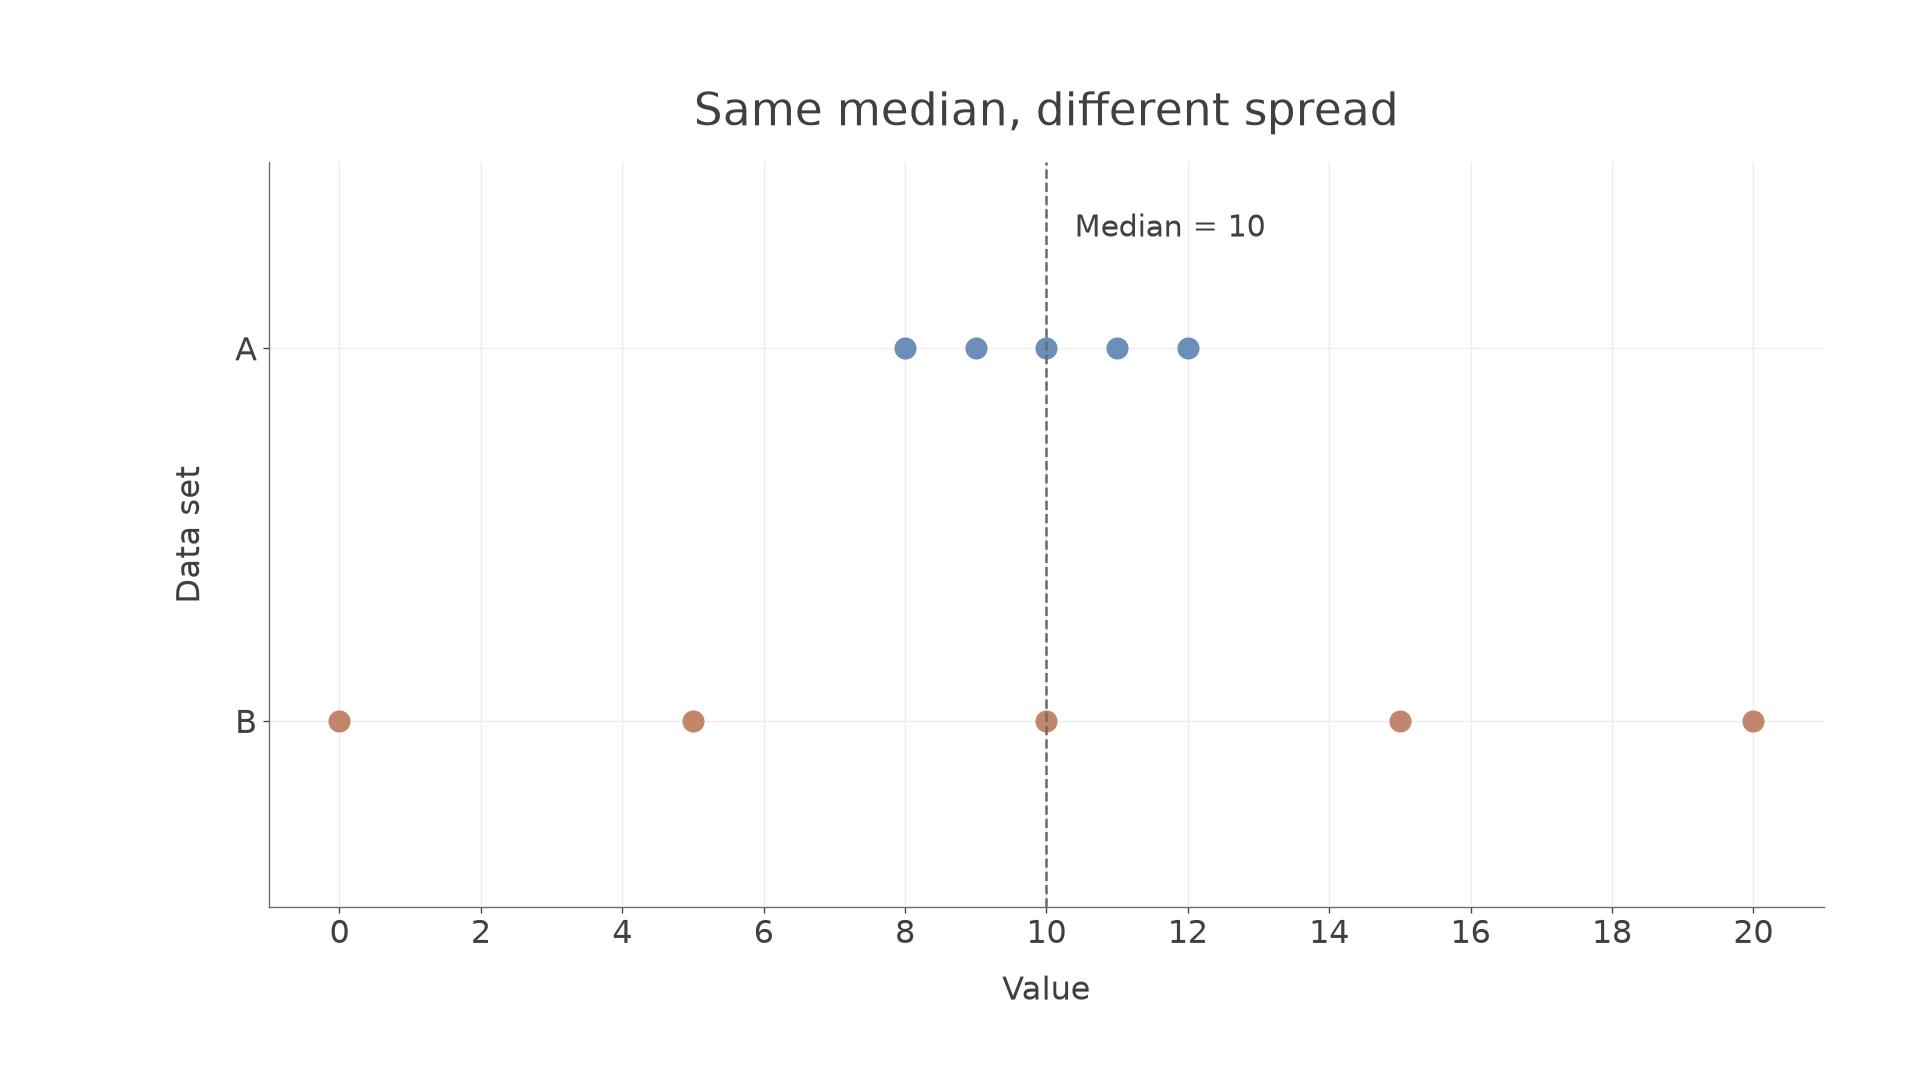
Check. Both lists have two positions on either side of , but their endpoints differ.
Change only B's largest value from to . The new value remains largest, so the order of the other observations stays fixed.
Worked example 2: move one endpoint
Question. Find B's revised median and range, then compare it with unchanged A.
Plan. Keep the middle position and update the largest endpoint.
Why is the median unchanged? The observation in the middle position did not change.
Answer. B still has median , but its range is ; A still has the smaller range, .
Check. B's maximum rose by , and its range also rose by .
Compare the same variable in the same units. Convert minutes and seconds before comparing numerical spreads. A spread describes these observations, rather than guaranteeing the size of future variation.
Watch out
The conclusion “equal medians mean equal spread” is false: the first example has ranges and . A median supplies a centre, not a spread.
The check changes the endpoints again while keeping the middle values equal. Use the range relationship; it is not in the Higher formulae sheet.
Quartiles and interquartile range (Higher)
Quartiles locate the lower and upper edges of the central portion of ordered data.
The lower quartile, , lies near one quarter of the way through the ordered observations. The upper quartile, , lies near three quarters. Their difference measures central spread, rather than average.
Interquartile range
The IQR has the same unit as the data. Not in the Higher formulae sheet: learn it.
Small discrete lists have several quartile conventions. Here we use medians of halves: order every observation; split an even-sized list equally; for an odd-sized list exclude the overall median, then split the rest equally. Find the median of each half, averaging its two middle values if needed. Our tasks state that convention. Follow a different stated convention when a question gives one; calculator quartiles can use another rule. Do not mix rules in one comparison.
Worked example 3: quartiles for eight observations
Question. Find , and the IQR of , using medians of halves.
Plan. Split the ordered list into equal halves, then find their medians.
Why average pairs within each half? Each half has four values, so each has two middle positions.
Answer. , , IQR .
Check. ; the IQR is between zero and the range .
Change only the observation count by inserting one value, , at the centre. The odd-list convention now matters.
Continue this lesson.
You’re previewing NovaLearn without an account. Create a free account to read the rest.
Create free account