3.3 - Interpreting real-life and conversion graphs
The same shape can tell different stories when the axis labels change. You will interpret journeys, changing speeds and curved graphs, then draw and use a straight conversion graph. Reading the quantities, units and scales comes before doing any calculation.
Distance-time graphs
Can a horizontal line show someone moving? On one kind of graph it can; on another it shows a stop. Start by checking what the vertical axis measures, rather than guessing from the shape.
You already know
A gradient measures vertical change divided by horizontal change. Speed is distance divided by time; change minutes to seconds if the required unit is metres per second.
On a distance-time graph, time is horizontal and distance is vertical. To read a distance, go vertically from the time to the graph, then horizontally to the distance axis. A straight rising section shows constant speed. A steeper rising section shows greater speed, when the axis scales are unchanged. A horizontal section shows no change in distance, so the object is stopped.
Speed from a distance-time section
For a rising straight section this is its gradient. Not in the Foundation or Higher formulae sheet: learn it.
Read the distance label carefully. Distance from the start can fall during a return journey; the negative gradient then describes movement towards the start, and speed is its magnitude. Total distance travelled cannot fall. A return journey adds to the total distance even while the distance from the start decreases.
[DIAGRAM: asset_slug: m050_journey; caption: Distance from the start during a journey with a two-minute stop; description: Exact straight sections join 0 comma 0, 4 comma 600, 6 comma 600 and 10 comma 1400, with time in minutes and distance in metres; file: m050_journey.png; recommended_method: matplotlib]
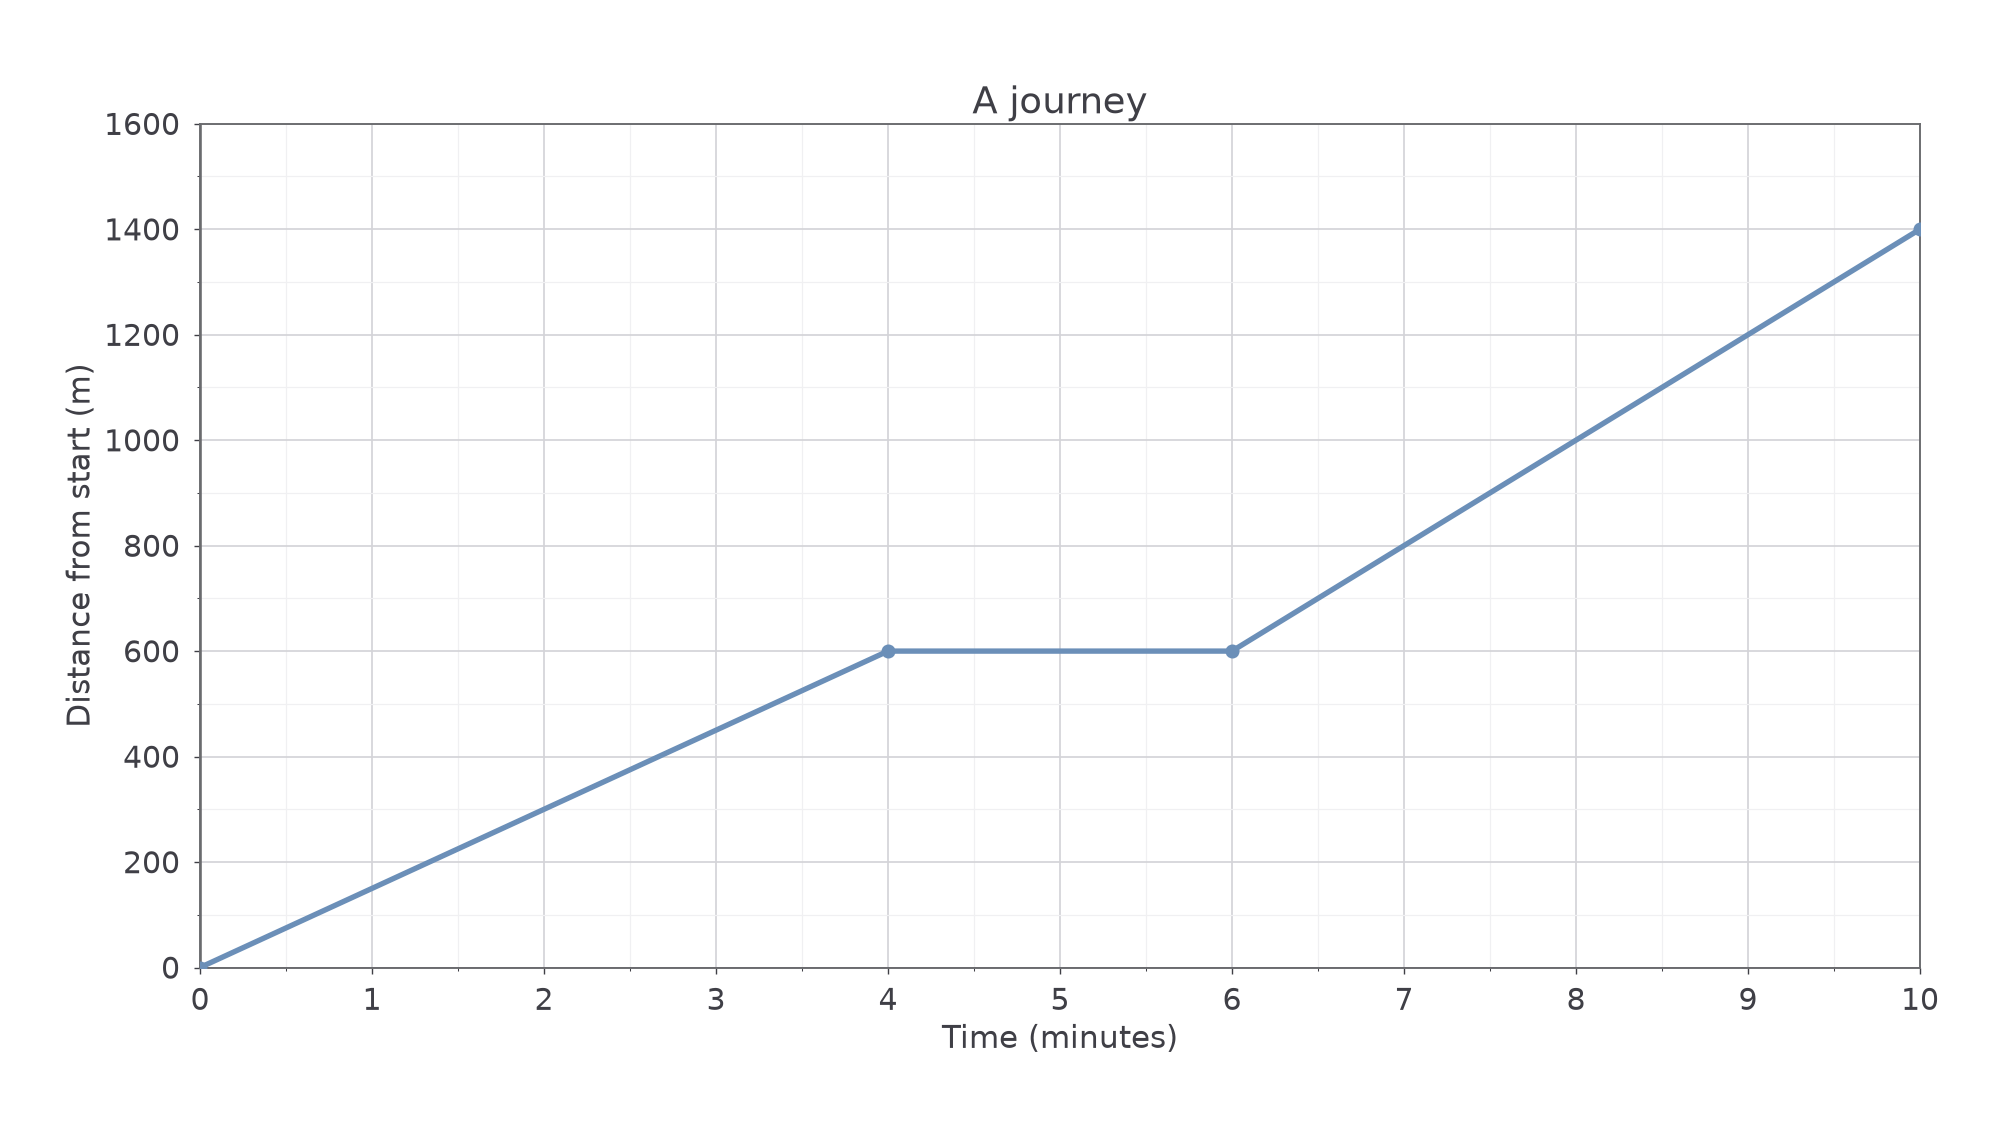
The two moving sections in this graph have equal durations. Their rises differ, so their speeds differ too.
Worked example 1: read a whole journey
Question. A distance-from-start graph joins , , , , with time in minutes and distance in metres. Find the two moving speeds, stop duration and overall average speed.
Plan. Use the changes within each section, then divide the whole distance by the whole time.
Why? A section speed uses that section's changes, while the overall average includes every minute, including time stopped.
Answer. Moving speeds and ; stop ; overall average .
Check. . Also for the first section.
A useful surprise: the overall average is lower than both moving speeds. The two-minute stop explains it. Taking the arithmetic mean of the moving speeds would miss that stopped time.
Change only the final distance coordinate to next. The final section now falls, so it represents a return towards the start.
Worked example 2: a return section
Question. A distance-from-start graph joins , , , , in minutes and metres. Find the final section's speed and the total distance travelled.
Plan. Find how far the person returns, then add that distance to the outward journey.
Why? The final height is the distance from the start, not the total length of the route already travelled.
Answer. Final speed ; total distance .
Check. The signed final gradient is . Its magnitude gives the speed; the person finishes from the start.
Both stories use the same graph-reading process. It is the final direction, and the precise vertical-axis label, that change the interpretation.
Watch out
The line does not give the last section's speed in example 1. Subtract the section endpoints: .
Read each section's horizontal width as an elapsed time, rather than as its ending time.
Speed-time graphs
On a speed-time graph, the height gives speed. A horizontal section above zero therefore shows movement at constant speed: this answers the opening puzzle. A section on the time axis shows a stop. An upward slope means speeding up, and a downward slope means slowing down, even while the object still travels forwards.
The gradient gives acceleration, the change in speed per unit time. With speed in and time in seconds, its unit is . A straight slope shows a uniform change in speed.
Acceleration and distance from a speed-time graph
Distance travelled is the area between the speed-time graph and the time axis. These results are not in the Foundation or Higher formulae sheet: learn them. The trapezium area formula is supplied on both sheets.
Why does area give distance? A constant speed makes a rectangle with area speed multiplied by time. For a uniform increase from zero, the average speed is half the final speed, making a triangle. Split more complicated shapes into these pieces. The units check the result: .
[DIAGRAM: asset_slug: m050_speed; caption: Speed rising uniformly, remaining constant and then falling to zero; description: Speed in metres per second against seconds joins 0 comma 0, 4 comma 12, 10 comma 12 and 14 comma 0; file: m050_speed.png; recommended_method: matplotlib]
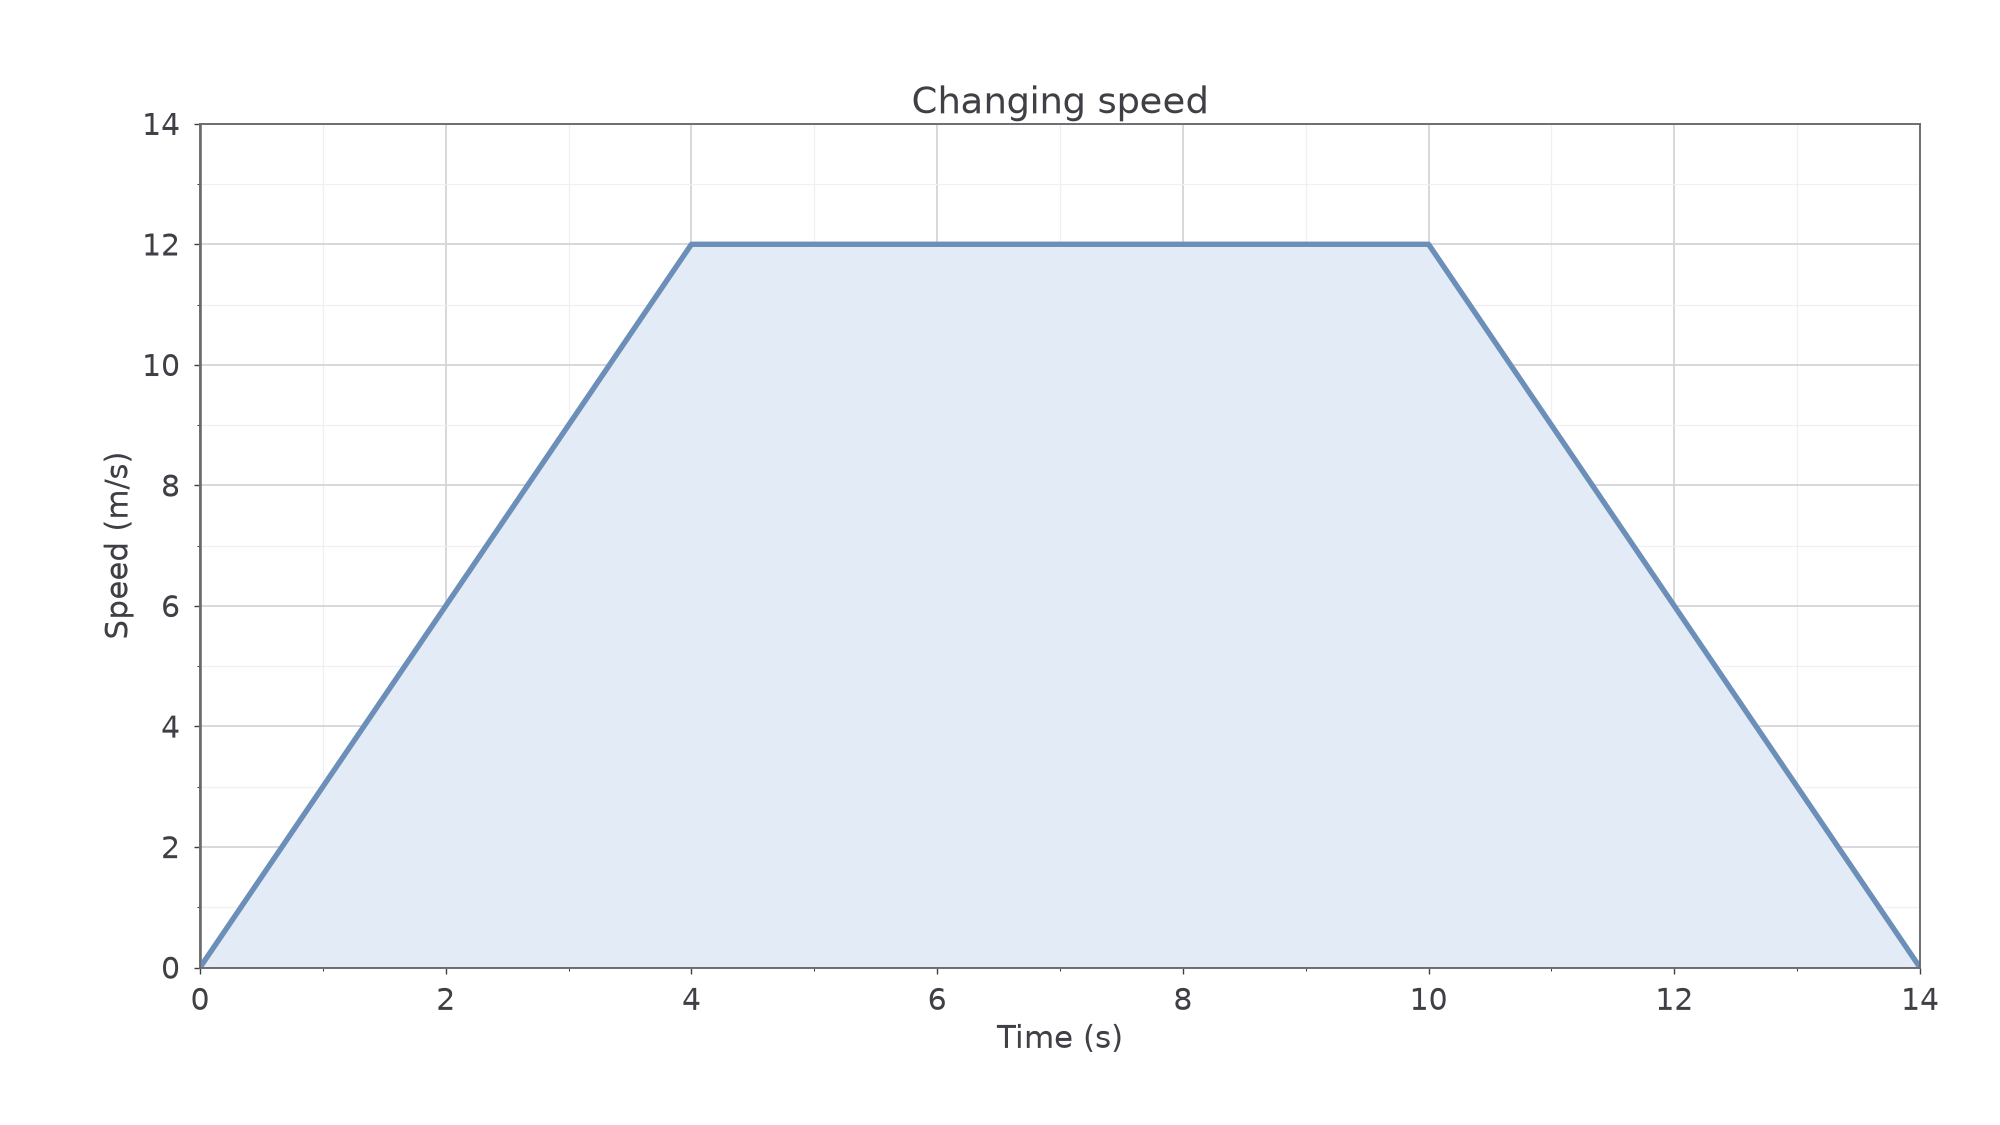
The shaded area contains two triangles and one rectangle. Each width is a time difference.
Worked example 3: acceleration and distance
Question. A speed-time graph joins , , , , with seconds horizontally and vertically. Find the initial acceleration and total distance.
Plan. Use the initial slope for acceleration and add the three areas for distance.
Why? Height alone gives speed; distance needs both speed and the time for which it acts, represented by area.
Answer. Initial acceleration ; total distance .
Check. One trapezium gives too.
Keep all times the same and change only the peak speed from to . The shape has the same widths, so every area becomes two-thirds as large.
Worked example 4: change the peak speed
Question. A speed-time graph joins , , , , in seconds and . Find the initial acceleration and total distance.
Plan. Repeat the slope and area calculations with the new height.
Why? Changing the height changes speed, acceleration and distance; it does not change the elapsed times.
Answer. Initial acceleration ; distance .
Check. , agreeing with the direct area calculation.
The falling part shows braking. Its speed stays non-negative, so its area still adds to distance travelled; it does not subtract distance.
Watch out
Using for the rectangle in example 3 is wrong: is the ending time. Its width is , so its area is .
A description in words can supply the same time and speed information as a drawn graph.
Continue this lesson.
You’re previewing NovaLearn without an account. Create a free account to read the rest.
Create free account