2.8 - Regions defined by linear inequalities
Use coordinate graphs to show where several linear inequalities hold together. Learn to draw boundaries, choose the correct side and identify the common region, then extend the method to harder sloping constraints.
Boundaries and half-planes
The point is right of the vertical axis and above the horizontal axis. Does that guarantee it belongs to the region , , ? We need a way to check every restriction, not just the first two.
You already know
The first coordinate is ; the second is . Larger -values lie to the right and larger -values lie above. A point belongs to a straight line when its coordinates satisfy the line's equation.
For , every allowed point has first coordinate at least . The second coordinate can vary freely, so a whole side of the plane is selected.
Boundary and half-plane
The boundary is the line obtained by replacing the inequality with equality. A half-plane is one side of that line, with boundary points included when equality is allowed. For , the boundary is , and the allowed side is to its right. The point is not on that side.
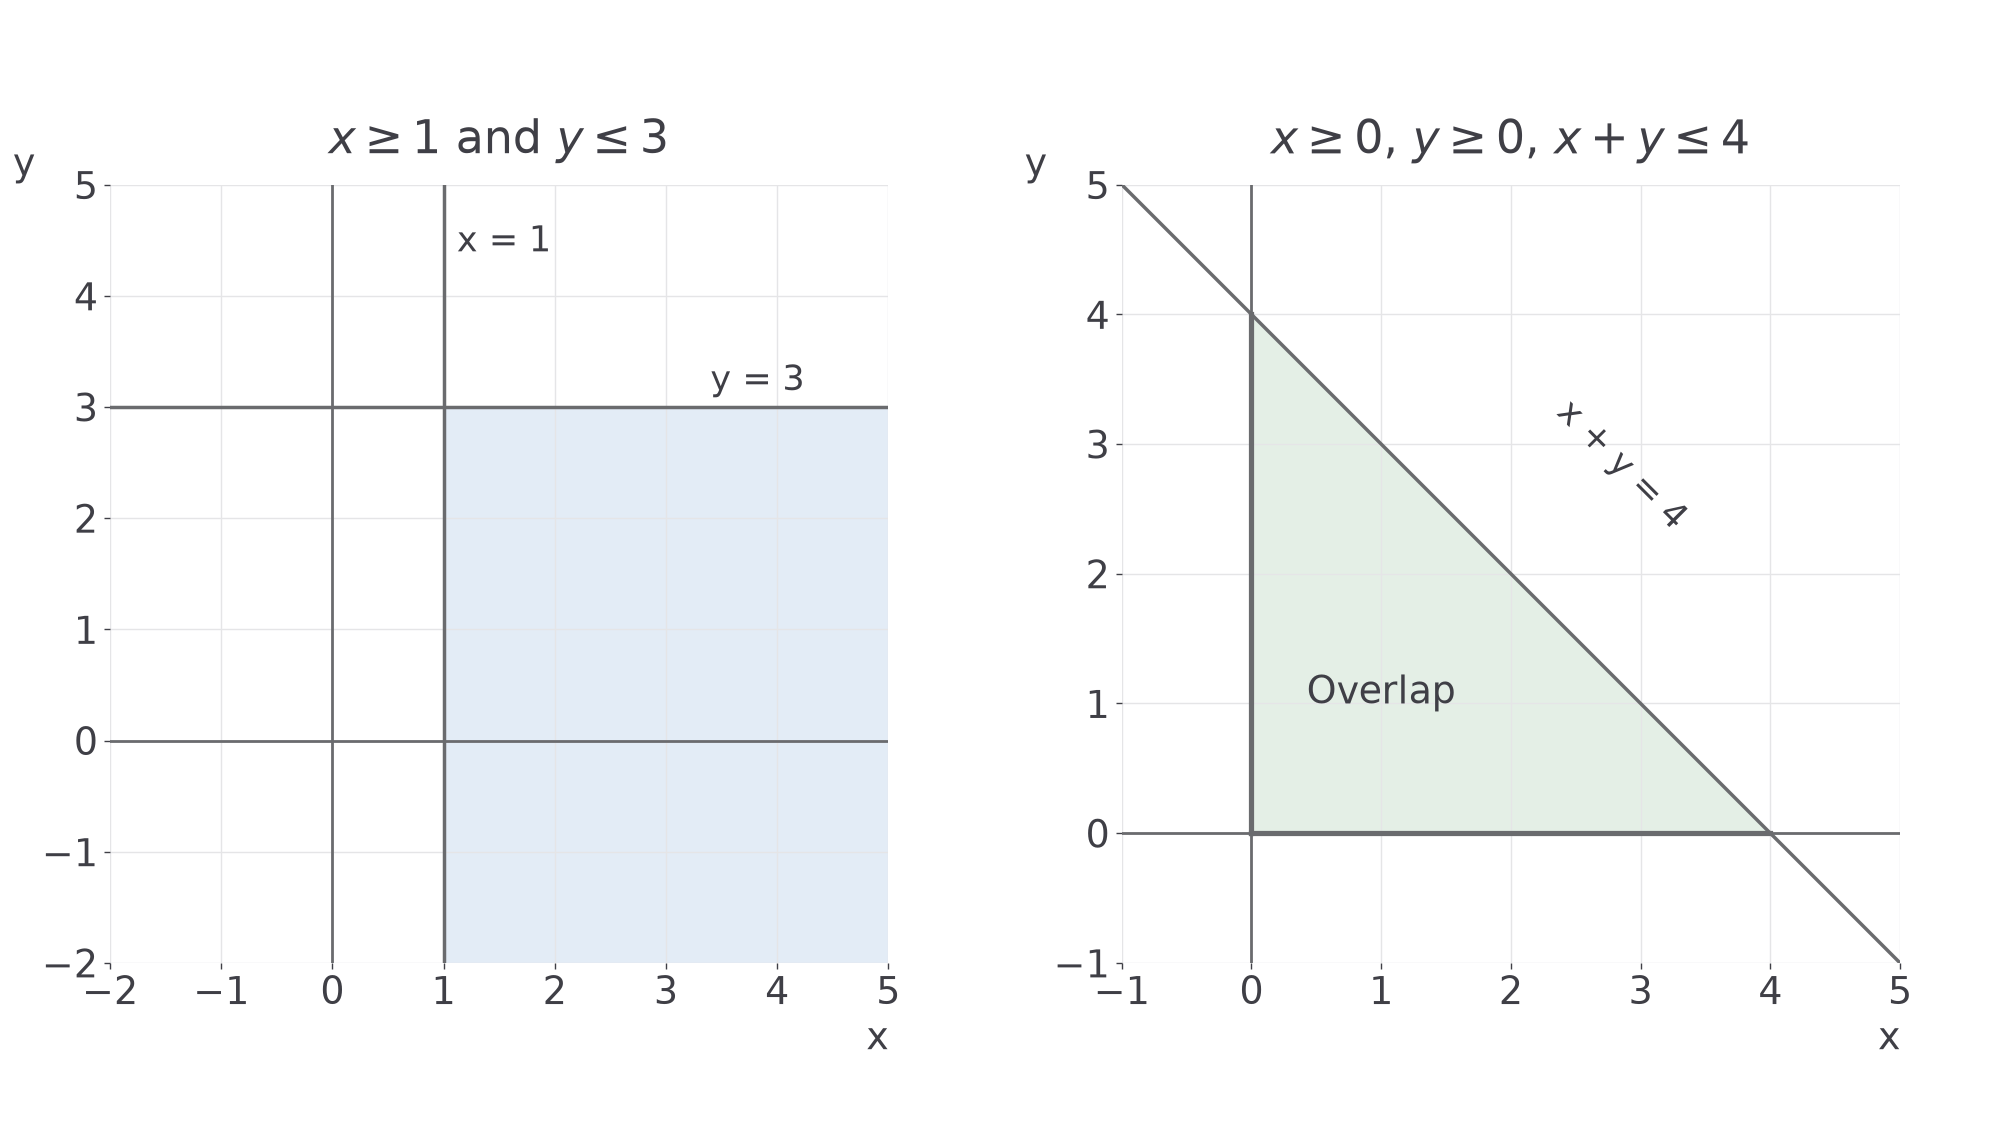
The line is vertical: all its points have first coordinate . The line is horizontal: all its points have second coordinate . Their overlap appears in the left panel.
[DIAGRAM: asset_slug: m040_simple_half_planes; caption: Coordinate regions to the right of x equals 1 and below y equals 3, and a first-quadrant triangle below x plus y equals 4; description: Left panel shades the overlap x at least 1 and y at most 3; right panel shades x and y nonnegative and x plus y at most 4; file: m040-foundation-region.png; recommended_method: matplotlib]
Worked example 1: choosing two sides
Question. Describe and represent the region , .
Plan. Draw the equality boundaries, select each allowed side, then mark their overlap.
Why keep the lower-right overlap? Its points satisfy both coordinate restrictions.
Answer. Right of and below , as in the left panel. Label the required region.
Check. passes both conditions. fails the first, so it is outside.
Change only the direction of the horizontal restriction. The two boundary lines stay in place.
Worked example 2: changing one allowed side
Question. Describe and represent , .
Plan. Keep the vertical restriction, then choose the side above the horizontal boundary.
Why does the region move upward? Only the allowed -values have changed.
Answer. Right of and above , including the allowed boundaries.
Check. passes both; fails the first condition.
The coordinate names decide whether a line is vertical or horizontal; the inequality direction decides which side to select. These graph rules are not in either tier's formulae sheet: learn them.
Watch out
The wrong claim “ means above ” swaps the coordinates. For example, satisfies despite lying below . Draw the vertical line and select its right side.
Make the two boundaries and the common region clear in your response.
The overlap of several inequalities
With several constraints, a point belongs only if it satisfies every inequality. The shared region is their intersection, meaning their common overlap. Passing two conditions out of three is not enough.
For a sloping boundary, find two points on its equation and join them with a ruler. Choose a test point away from the boundary, substitute its coordinates and select its side if it passes. A boundary point cannot distinguish the two sides.
Worked example 3: drawing a triangular region
Question. Represent , , .
Plan. Restrict to the first quadrant, plot the sloping boundary from its intercepts, then test the origin.
Why select the side containing the origin? It satisfies the sloping inequality, so its whole side is allowed.
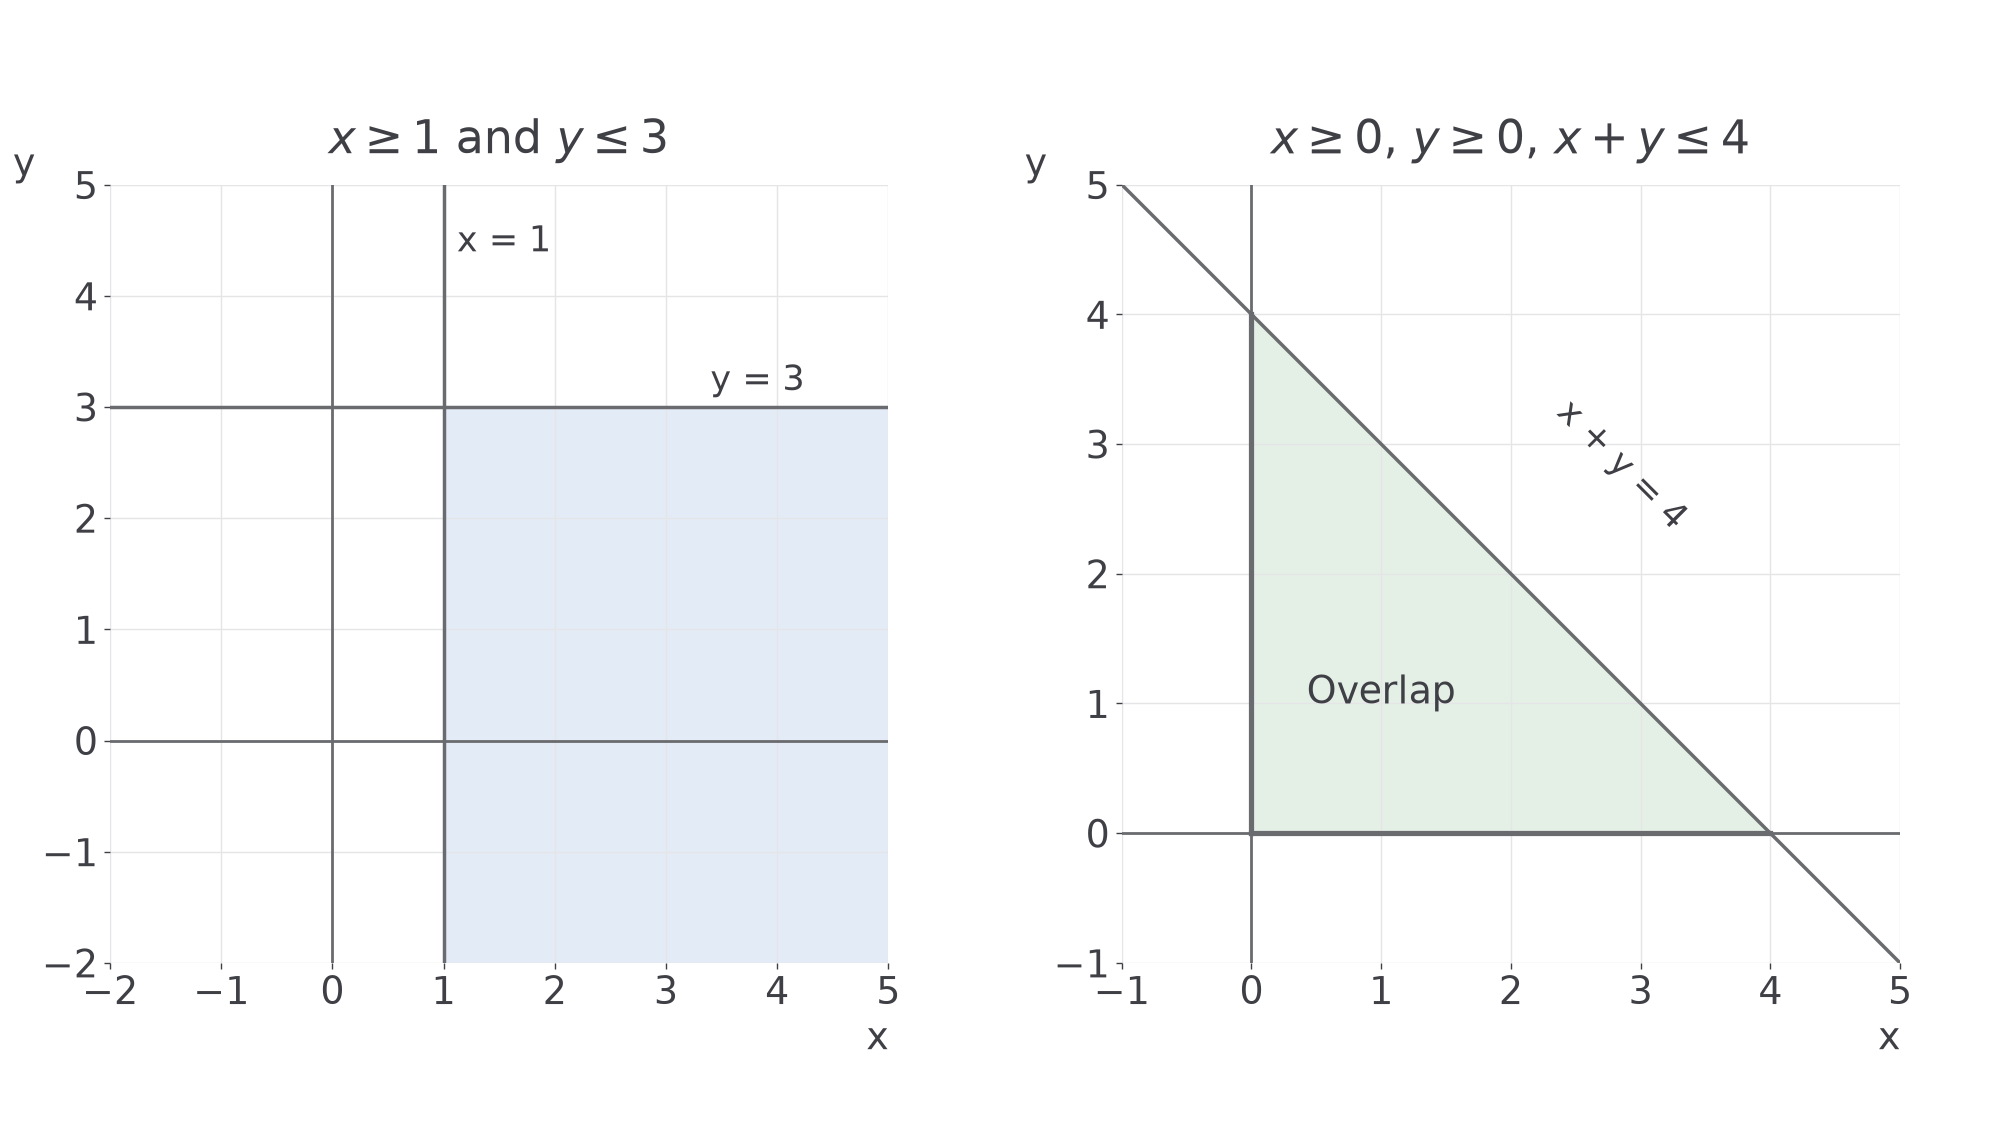
Answer. The triangle with vertices , and , including its boundaries.
Check. passes all three conditions because . fails because .
The right panel shows the resulting bounded region. Here is a useful mathematical surprise: three half-planes that each extend forever can overlap in a finite triangle.
[DIAGRAM: asset_slug: m040_simple_overlap; caption: The right panel shows the first-quadrant triangle below x plus y equals 4; description: Right panel has exact triangle vertices 0 comma 0, 4 comma 0 and 0 comma 4, showing the intersection of three inclusive inequalities; file: m040-foundation-region.png; recommended_method: matplotlib]
Now change only the sloping boundary's intercept value from to . Read the inequalities from a description of the larger region.
Continue this lesson.
You’re previewing NovaLearn without an account. Create a free account to read the rest.
Create free account