3.3 - Plotting linear and quadratic graphs
An equation is a compact way to describe many points. You will calculate those points and turn them into straight lines or smooth quadratic curves, including equations that fix one coordinate. A well-chosen table and a few checks help you spot a wrong point before it spoils the graph.
Plot a straight line from an equation
Can a graph pass through every point in your table and still be drawn wrongly? Yes: the way you join the points matters. We will start with a straight line, then see what changes for a curve.
You already know
In , horizontal position comes first. Substitute a negative input using brackets, and read each axis scale before plotting.
A graph contains the coordinate pairs that satisfy its equation. For , the input gives , so is on the graph. The point is not: it fails the equation.
Linear graph
A linear equation in two variables has a straight-line graph. For , equal increases in give equal changes in , because the gradient is constant.
A table of values lists inputs and their calculated outputs. Choose a regular axis scale that fits every value in the requested interval. The two axes may use different scales, but the spacing along each axis must be consistent. These plotting rules and the form are not in either tier's formulae sheet: learn them.
Worked example 1: turn a table into a line
Question. Draw for .
Plan. Substitute integer inputs, plot the resulting pairs and join them with a ruler.
Mark a small cross at each pair. Draw one straight segment through the points, from the first input to the last.
Why? This equation has a constant change of in for every in , so a straight line is required.
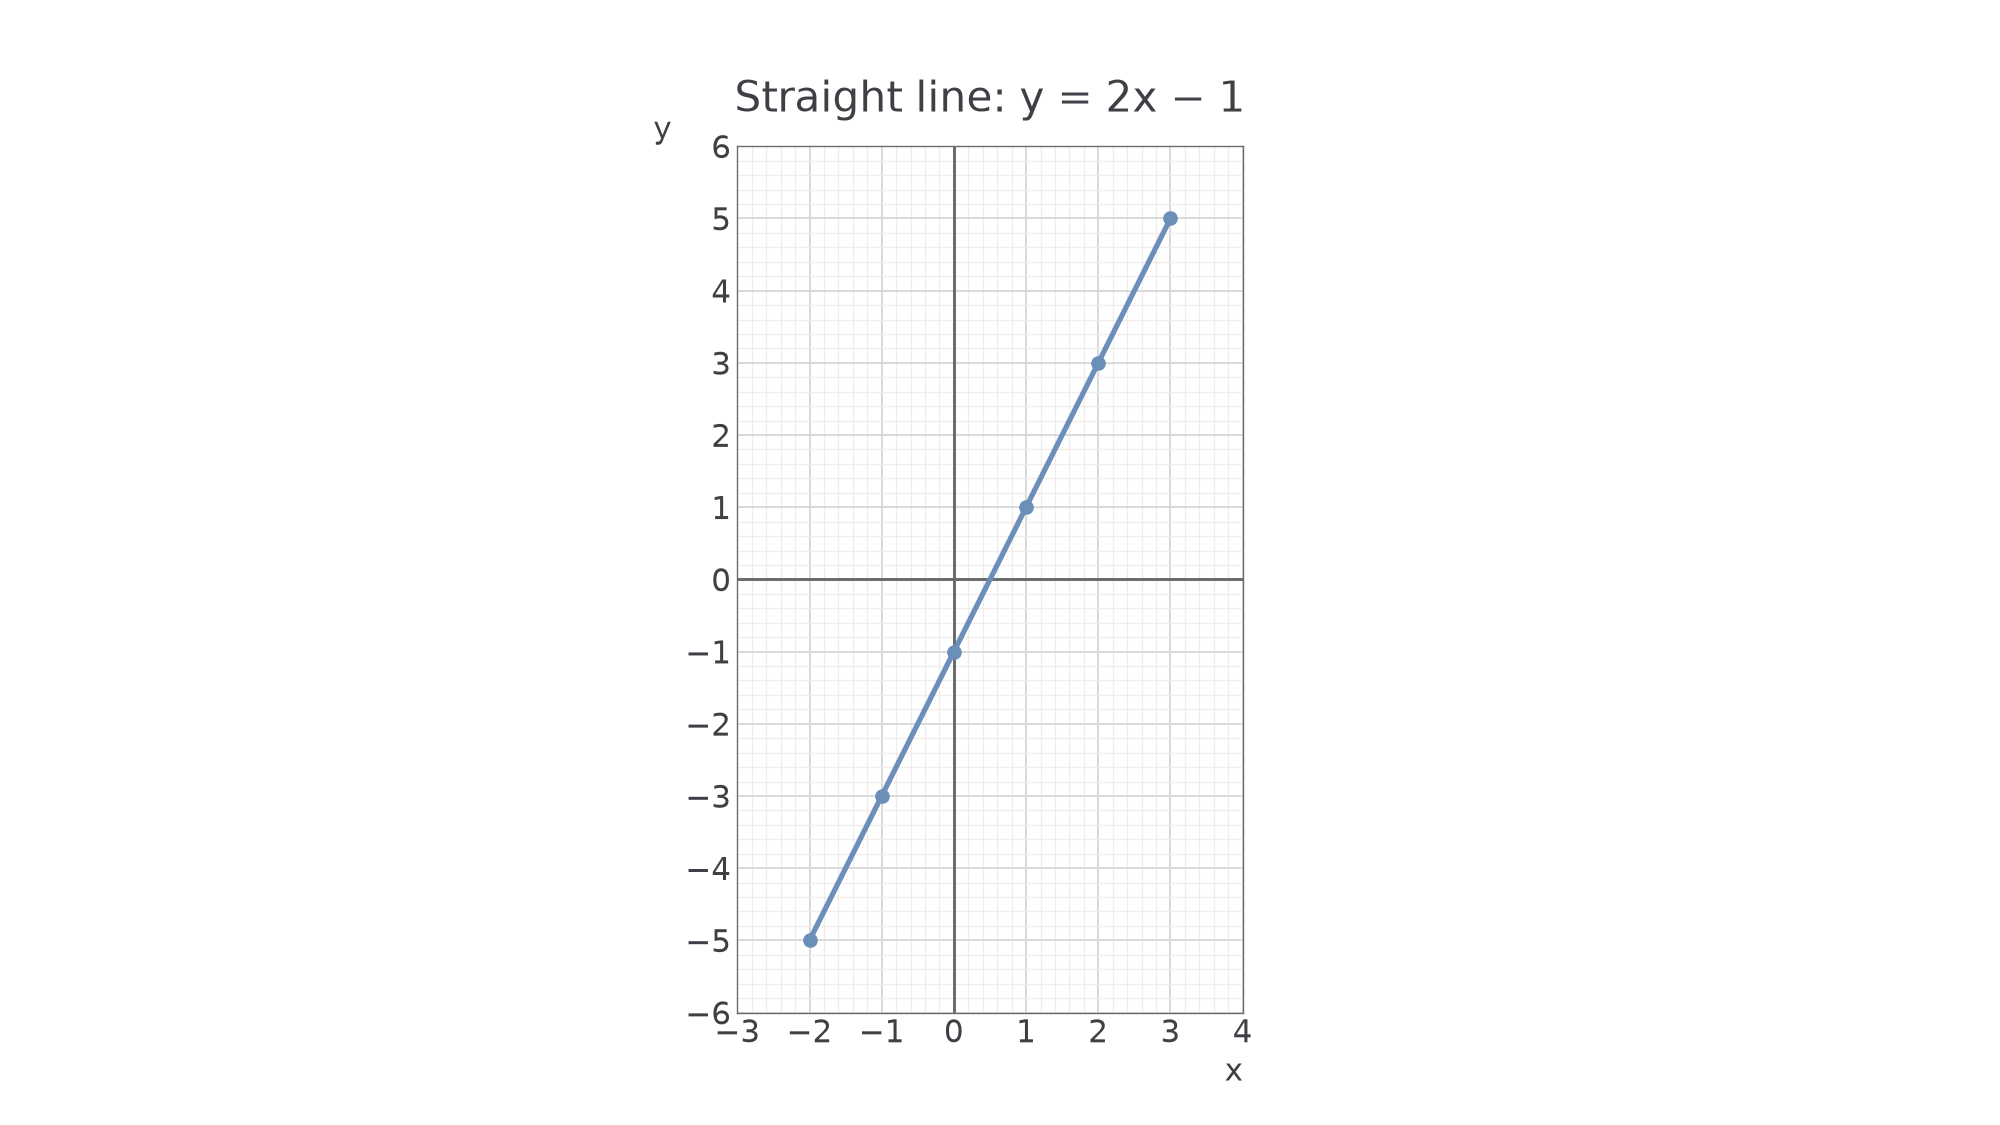
Answer. The graph is the straight segment from to , shown below.
Check. All outputs rise by , and the line crosses the vertical axis at .
The regular pattern is useful: if one calculated point is off the line, recheck it instead of bending the line to visit it. Two distinct points determine a straight line; a third point checks your arithmetic and plotting.
[DIAGRAM: asset_slug: m049_linear_plot; caption: The six calculated points lie on one straight line from x equals minus 2 to x equals 3; description: Exact equal-unit grid for y equals 2x minus 1, with points minus 2 comma minus 5, minus 1 comma minus 3, 0 comma minus 1, 1 comma 1, 2 comma 3 and 3 comma 5 joined by a straight segment; file: m049_linear_plot.png; recommended_method: matplotlib]
Now change only the constant, from to . Every output is higher, but the change between consecutive outputs remains .
Worked example 2: change the constant
Question. Draw for .
Plan. Calculate the table and use one straight ruler line through the plotted pairs.
Choose axes that include , plot all six pairs and join across the stated interval.
Why? The coefficient of has not changed, so the graph has the same steepness as example 1.
Answer. A straight segment from to , passing through .
Check. Substituting gives , which agrees with the table and line.
The table is a preparation for drawing, not a replacement for the plotted graph when a paper question asks you to draw it.
Watch out
The line loses the negative sign. Multiply first: , then add , giving .
Use the equation to generate two more points with a new constant.
Recognise special straight lines
Some equations describe a line without being written as . Ask what stays fixed, or which coordinate pairs satisfy the equation.
For , every point has horizontal position , while its height can vary: the line is vertical. For , every point has height , while its horizontal position can vary: the line is horizontal. More generally, is vertical and is horizontal.
[DIAGRAM: asset_slug: m049_special_lines; caption: A vertical line x equals 2, a horizontal line y equals minus 1, and the diagonal line y equals x; description: Three exact equal-unit coordinate diagrams with x equals 2 vertical, y equals minus 1 horizontal, and y minus x equals 0 identical to y equals x; file: m049_special_lines.png; recommended_method: matplotlib]
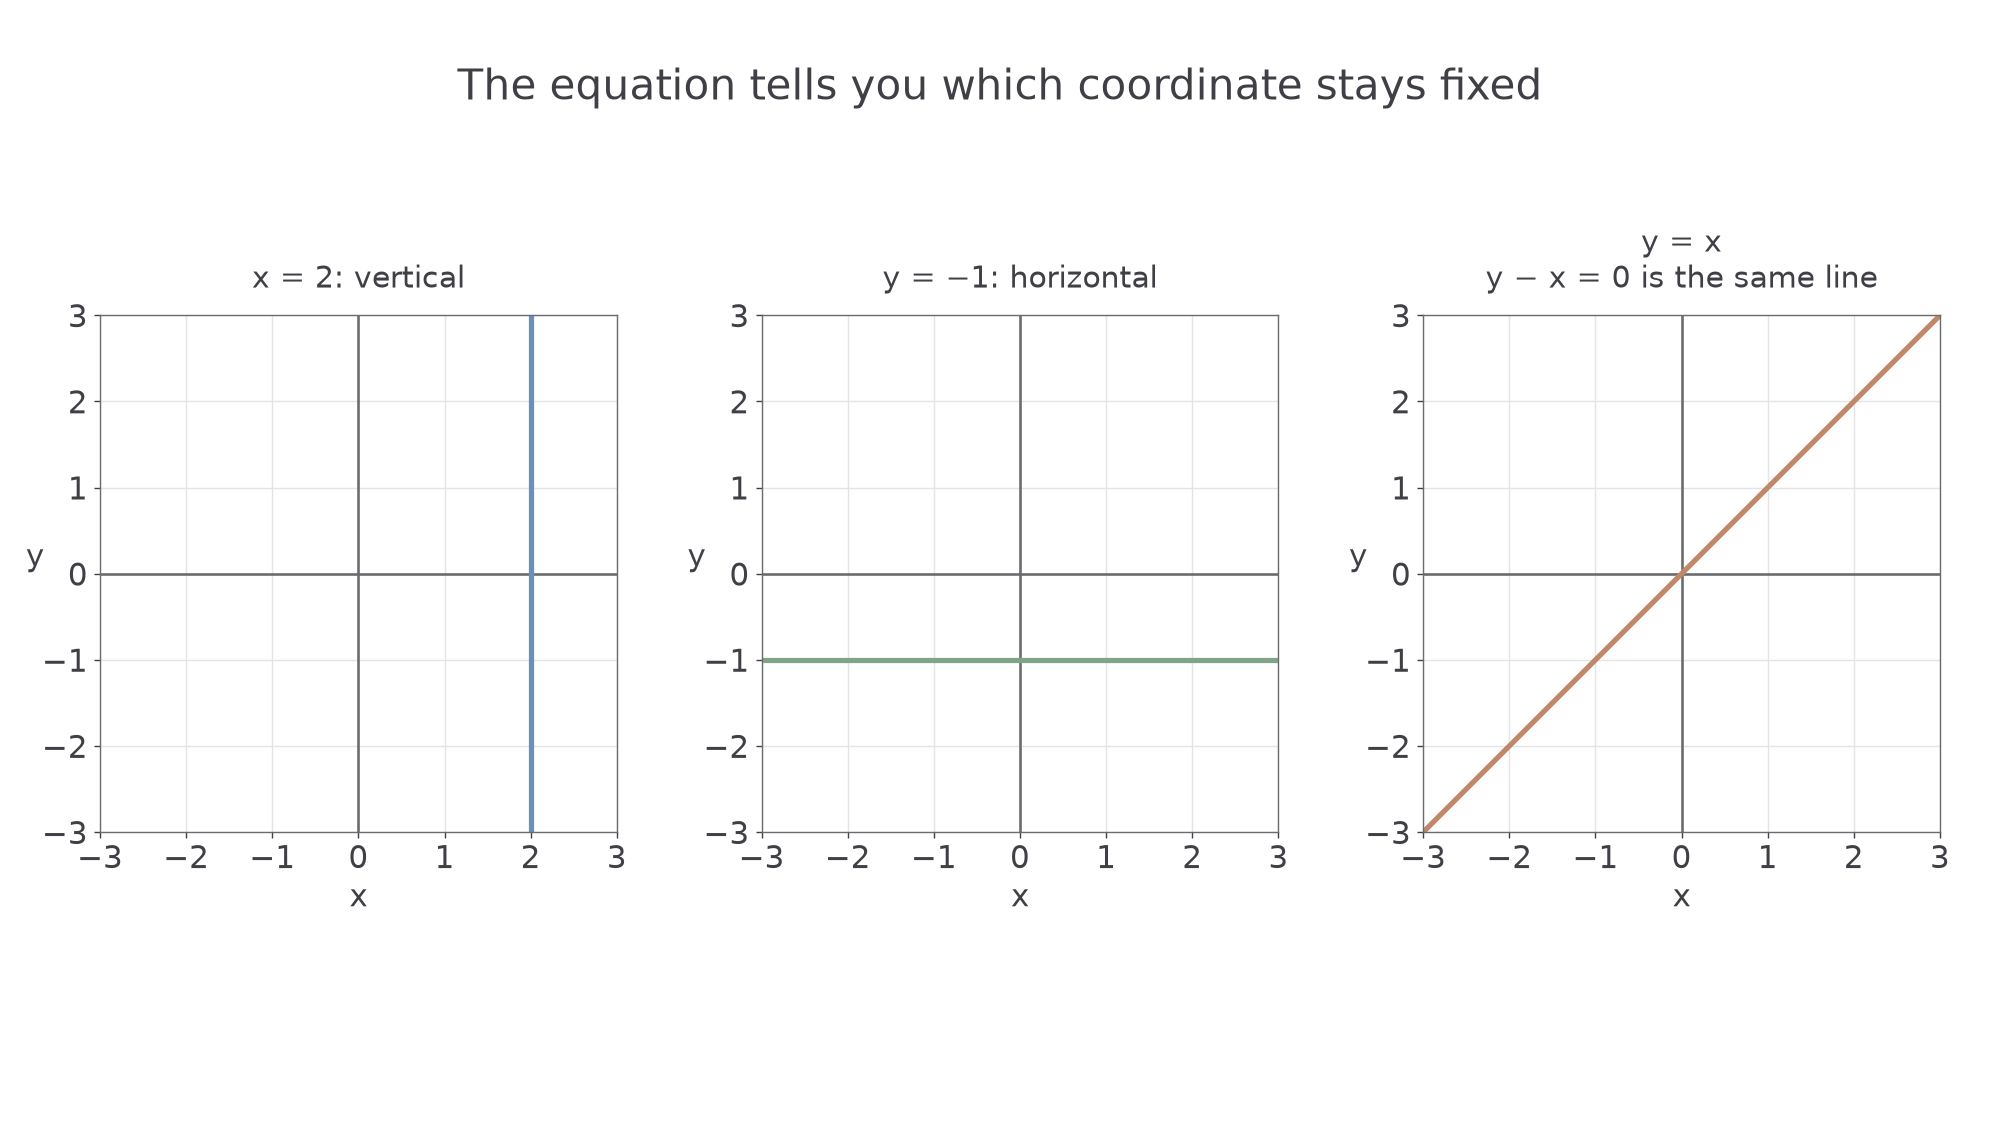
For , the coordinates are equal, so , and are on the line. Adding to both sides of gives ; these are two equations for the same line. These special forms are not in either tier's formulae sheet: learn to recognise them.
An equation of the form , where and are not both zero, also gives a straight line. You can rearrange it to calculate a table. Often, setting one variable to zero gives two convenient axis intercepts, the points where the line meets the axes.
Worked example 3: use two axis intercepts
Question. Draw the line .
Plan. Find a point on each axis, then join them with a ruler.
Why? On an axis, one coordinate is zero. This removes a term and makes a point easy to find.
Answer. Plot and , then draw the straight line through them.
Check. At , , so lies halfway between those intercepts and satisfies .
Continue this lesson.
You’re previewing NovaLearn without an account. Create a free account to read the rest.
Create free account