6.1 - Histograms and frequency density
Learn to construct and interpret histograms for continuous measurements with unequal class widths. You will use bar areas to recover frequencies and explain when a count is only an estimate.
Class widths and frequency density (Higher)
Can the tallest bar contain fewer pupils than a shorter bar? A waiting-time table will show why this can happen.
You already know
Rectangle area is width multiplied by height. A categorical bar chart uses separate equal-width bars; a histogram uses the actual numerical widths of measurement intervals.
A continuous variable, such as time or mass, can take values between recorded measurements. A class interval groups values between two boundaries. Its width is upper boundary minus lower boundary. For , the width is , not a count of written integers.
Frequency density
Frequency per unit of the measured variable. In a histogram, frequency density is bar height and frequency is bar area.
If height were frequency, a class twice as wide would gain twice the area for no extra observations. Dividing frequency by width prevents that distortion.
Histogram area
Not in the Higher formulae sheet: learn these relationships. Histograms are Higher content.
Start with the widths before calculating heights. Density and frequency answer different questions.
Worked example 1: turn frequencies into heights
Question. Find the histogram heights for these waiting times of pupils.
| Time in minutes | Frequency |
|---|---|
Plan. Divide each frequency by its own class width.
Why use different divisors? The last two classes are twice as wide as the first two.
Answer. The heights are pupils per minute. The tallest bar has pupils, fewer than the third bar's .
Check. Width times height recovers , totalling .
Change only the third frequency from to . Its interval stays minutes wide.
Worked example 2: change a frequency
Question. Find the changed height and compare the second and third bars.
Plan. Recalculate only the changed class's density.
Why can equal heights hide different counts? Their widths, and therefore their areas, differ.
Answer. Both bars have height , but the third contains twice as many pupils.
Check. The new total is , which is above the original total.
This is a useful surprise: equal height means equal density, not equal frequency. Area resolves the opening puzzle.
Watch out
The line uses frequency as height. Correct it to . Unequal widths require frequency density.
A tall narrow bar may contain fewer observations than a shorter wide bar. Calculate before deciding.
Constructing a histogram (Higher)
Construct each rectangle over its actual class interval, using a uniform scale on each axis.
The horizontal axis shows the variable and its unit. The vertical axis shows frequency density. Adjacent classes touch at their shared boundary; do not give every class the same drawn width. A zero-frequency interval has zero height. Draw accurate vertical sides and horizontal tops.
Worked example 3: draw the waiting-time histogram
Question. Construct the histogram for the original waiting-time table.
Plan. Mark boundaries on the horizontal scale, then draw the calculated heights.
Why are the last two rectangles wider? Each covers minutes rather than .
Answer. Draw the four touching rectangles shown below, with labelled axes.
[DIAGRAM: asset_slug: m087_histogram; caption: Waiting-time histogram with unequal widths and frequency-density heights of 1, 3, 2 and 1; description: Boundaries 0, 10, 20, 40 and 60 minutes with rectangle areas 10, 30, 40 and 20 pupils; file: m087_histogram.png; recommended_method: matplotlib]
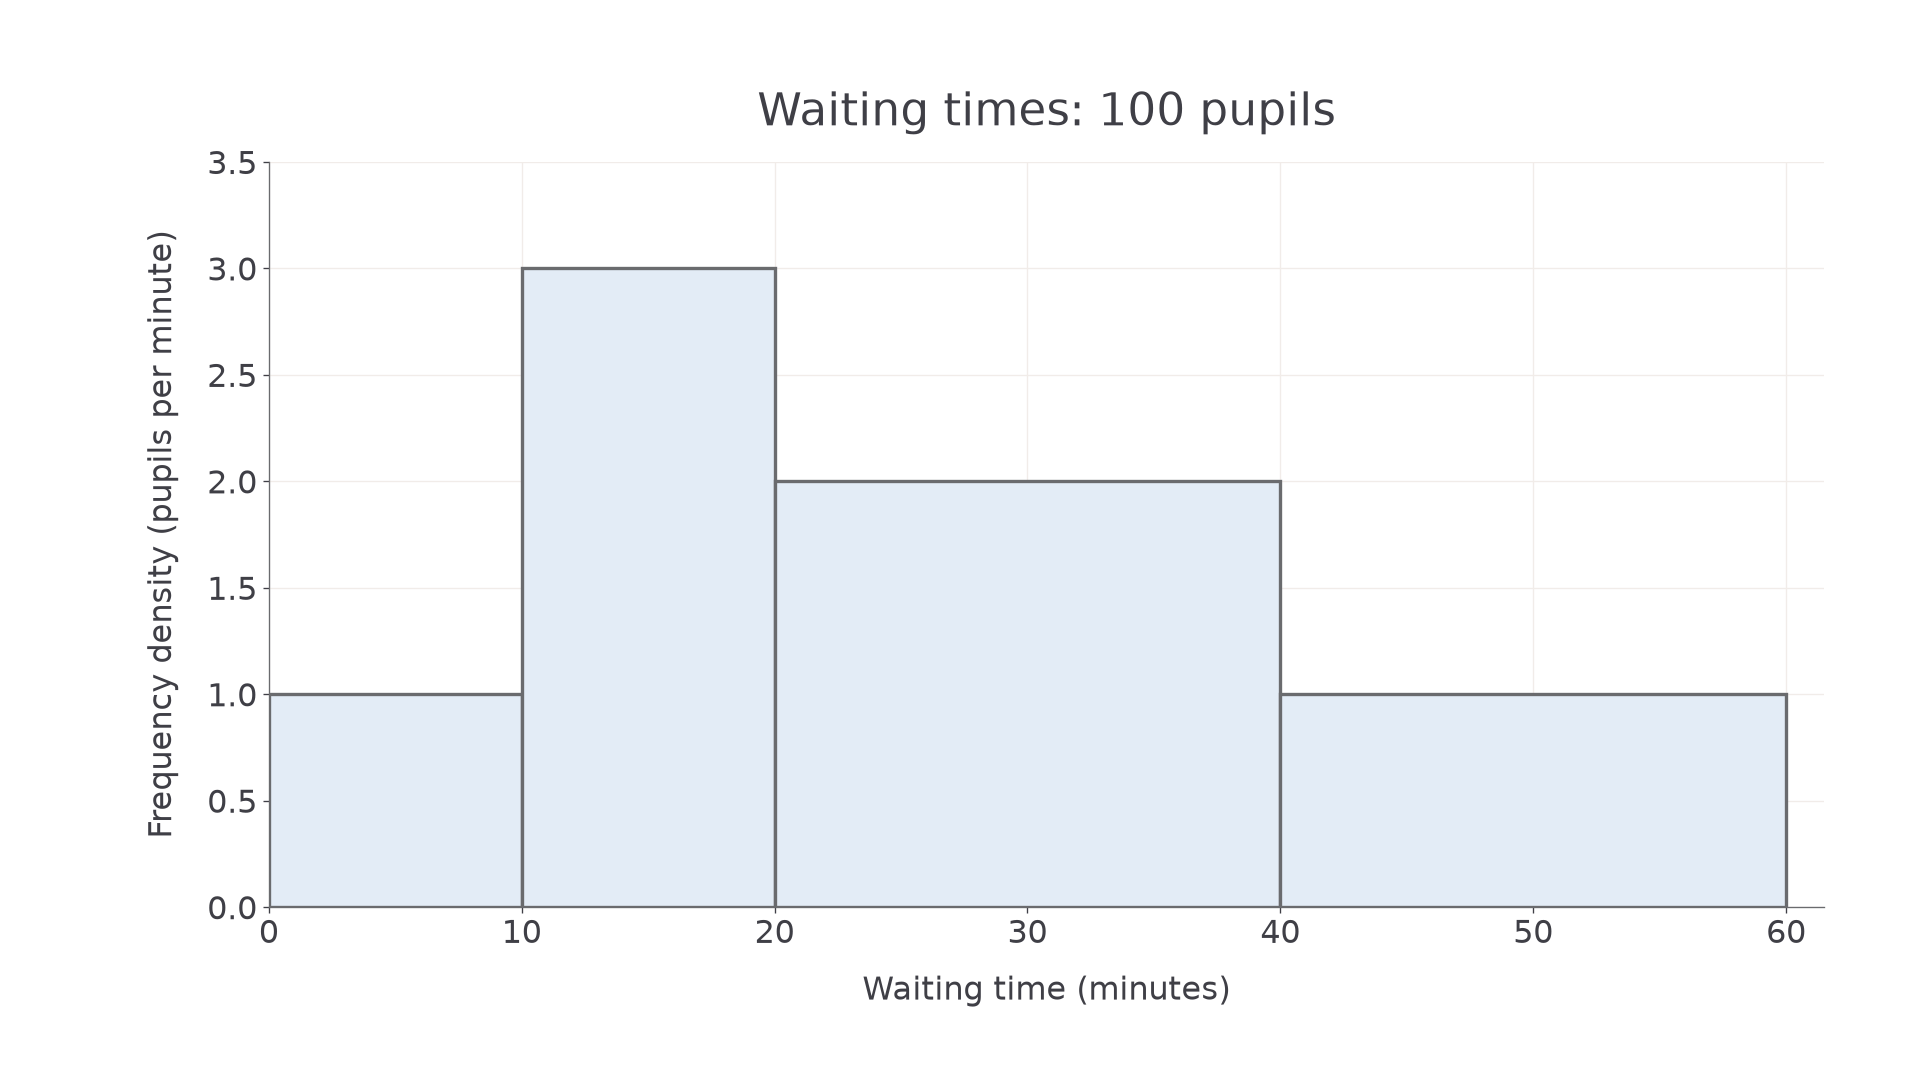
Check. The first and last have equal heights but areas and , matching their different frequencies.
Change only the final boundary from to minutes, keeping all four frequencies fixed. Only one width and its corresponding density change.
Worked example 4: widen the final class
Question. Redraw the waiting-time histogram with final class , still containing pupils.
Plan. Keep the first three bars and recalculate the last width and height.
Why does widening make this bar shorter? Its area must still represent the same pupils.
Answer. Draw the final bar from to with height ; retain the other three bars.
[DIAGRAM: asset_slug: m087_wider_last; caption: The same waiting frequencies with only the final class widened; description: The first three rectangles are unchanged and the last extends from forty to eighty minutes with density zero point five, preserving its frequency of twenty; file: m087_wider_last.png; recommended_method: matplotlib]
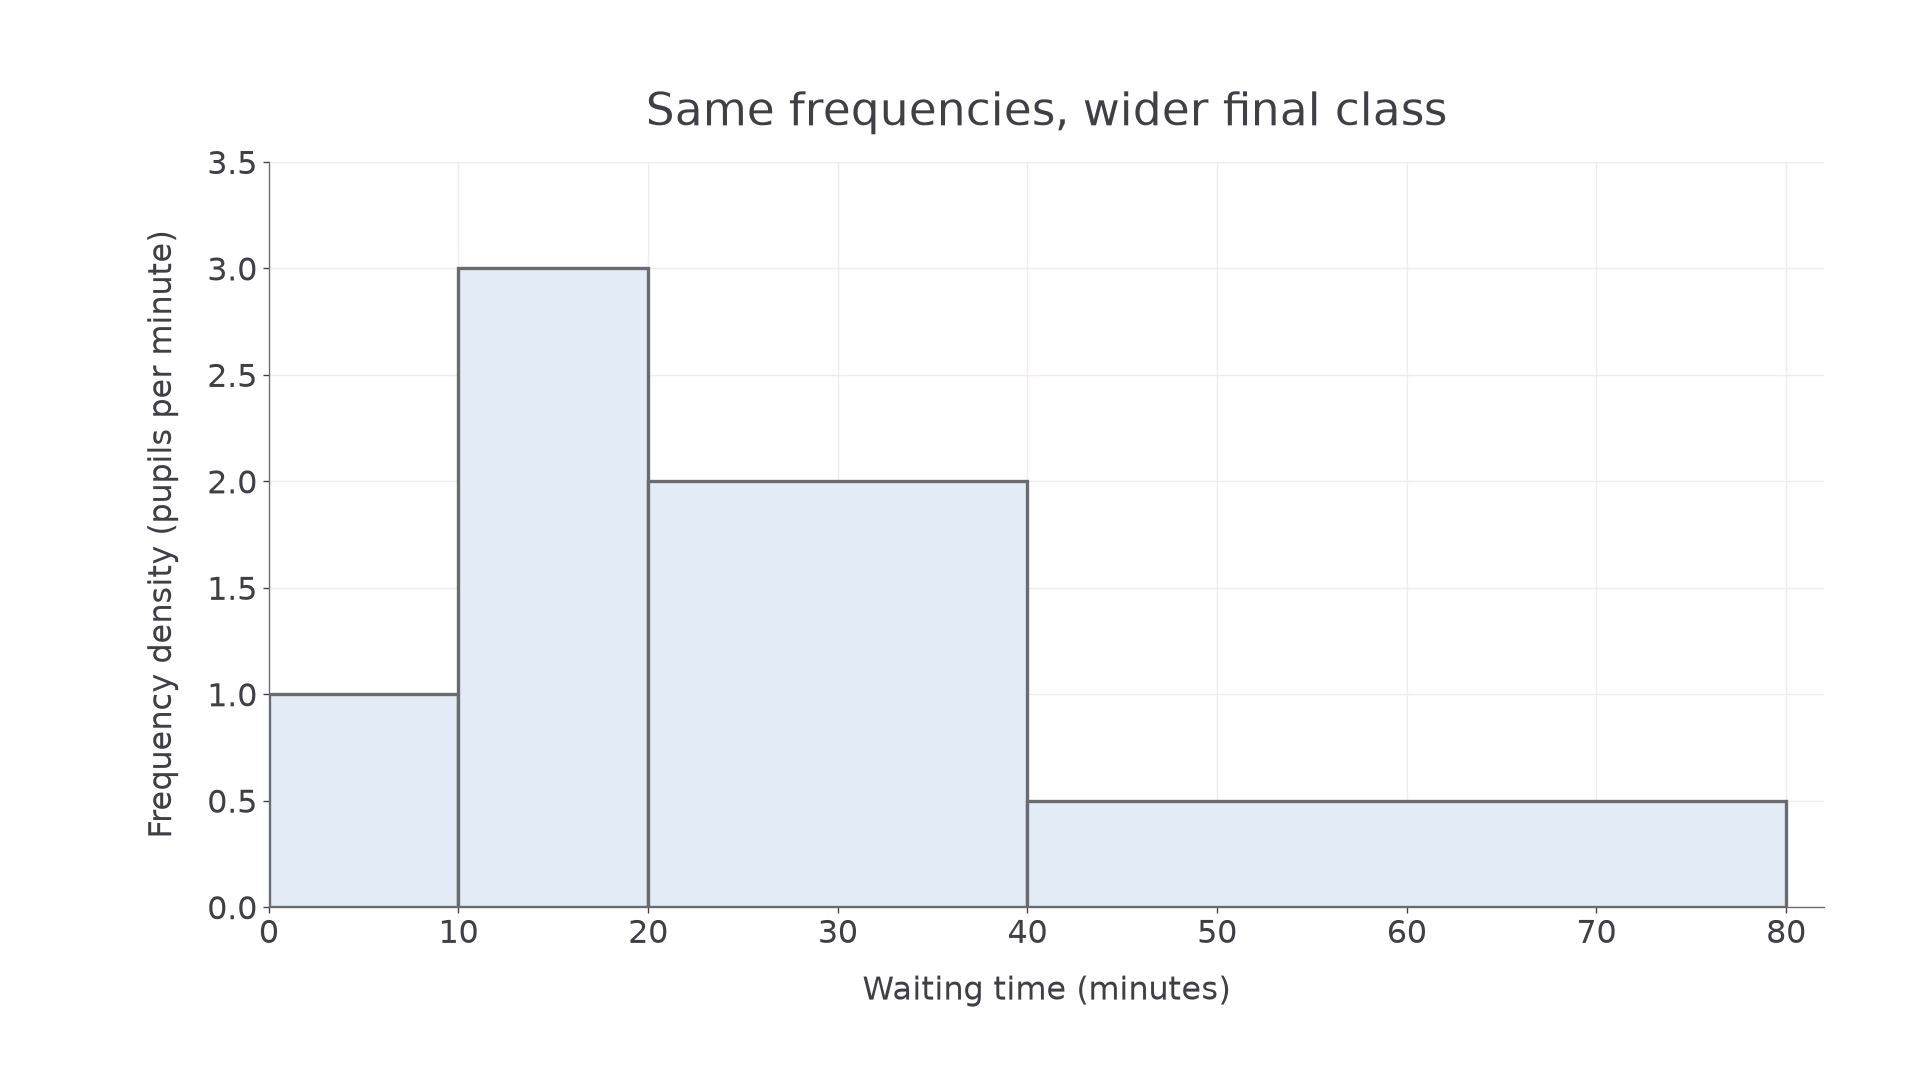
Check. The final area is ; all four areas still total .
Continue this lesson.
You’re previewing NovaLearn without an account. Create a free account to read the rest.
Create free account