6.1 - Tables, pictograms, bar charts and pie charts
Turn a collection of answers into a clear table or chart. You will construct and read pictograms, bar charts and pie charts, and decide what each display can tell you.
Two-way tables
Can a larger pie-chart sector represent fewer pupils? We will return to that puzzle after organising a survey of pupils.
You already know
You can add and subtract counts, find a fraction of a total and measure angles with a protractor. A full turn is .
Ask each pupil for one main way of travelling to school. This wording matters: counting every way they sometimes travel could count one pupil several times. Make categories that cover every answer without overlap, then tally each answer once. A frequency is a count.
Two-way table
A table that sorts the same observations by two characteristics, one in its rows and one in its columns. An interior cell meets both labels; the grand total counts all observations once.
Rows might show year group and columns might show travel choice. The totals also give a frequency table ready for a chart. Choose the totals for the group you want: the Year row describes Year , while the bottom row describes everyone.
Worked example 1: complete a travel table
Question. Find the two missing entries.
| Year group | Bus | Walk | Bike | Car | Total |
|---|---|---|---|---|---|
| Year 7 | |||||
| Year 8 | ? | ? | |||
| Total |
Plan. Subtract the known entry from each column total.
Why subtract? Each column total includes both year groups, so removing one leaves the other.
Answer. Both missing entries are pupils.
Check. The Year row totals , and the bottom row totals .
Change only the Year Bus entry to , with its row total now missing. Keep all column totals and the Year Bike and Car entries unchanged. This tests whether you follow the labels rather than reuse the earlier answer.
Worked example 2: change one survey entry
Question. With that change, find Year Bus and both year-group totals.
Plan. Complete the Bus column, then add across each row.
Why do the row totals change? The same pupils are now distributed differently between the two rows.
Answer. Year Bus is ; the row totals are and .
Check. , matching the unchanged grand total.
Use either a row or a column to find a missing cell, then use the other direction as a check. The counts must agree in both directions.
Watch out
The line double counts everyone. Row totals and column totals describe the same pupils. Add either set once to get .
Now try a different table. Its row and column labels supply the meaning of each subtraction.
Pictograms and their keys
A pictogram replaces counts with repeated equal-size symbols, so its key is part of the mathematics.
Pictogram
A display in which one full symbol represents a stated number of observations. A half symbol represents half that number.
Tabulate the frequencies first. Choose a key that gives manageable rows and easy fractions of symbols. Label the rows, align the symbols and keep their sizes equal. Show half of the same symbol for a half, rather than a smaller complete symbol whose meaning is unclear.
Worked example 3: read the key
Question. Read the library loans and find their total and the difference between Tuesday and Wednesday. One full circle represents books.
[DIAGRAM: asset_slug: m086_pictogram; caption: Library loans with one full circle representing six books and a half circle representing three; description: Monday has two circles for 12 books, Tuesday three for 18 and Wednesday one and a half for 9; file: m086_pictogram.png; recommended_method: matplotlib]
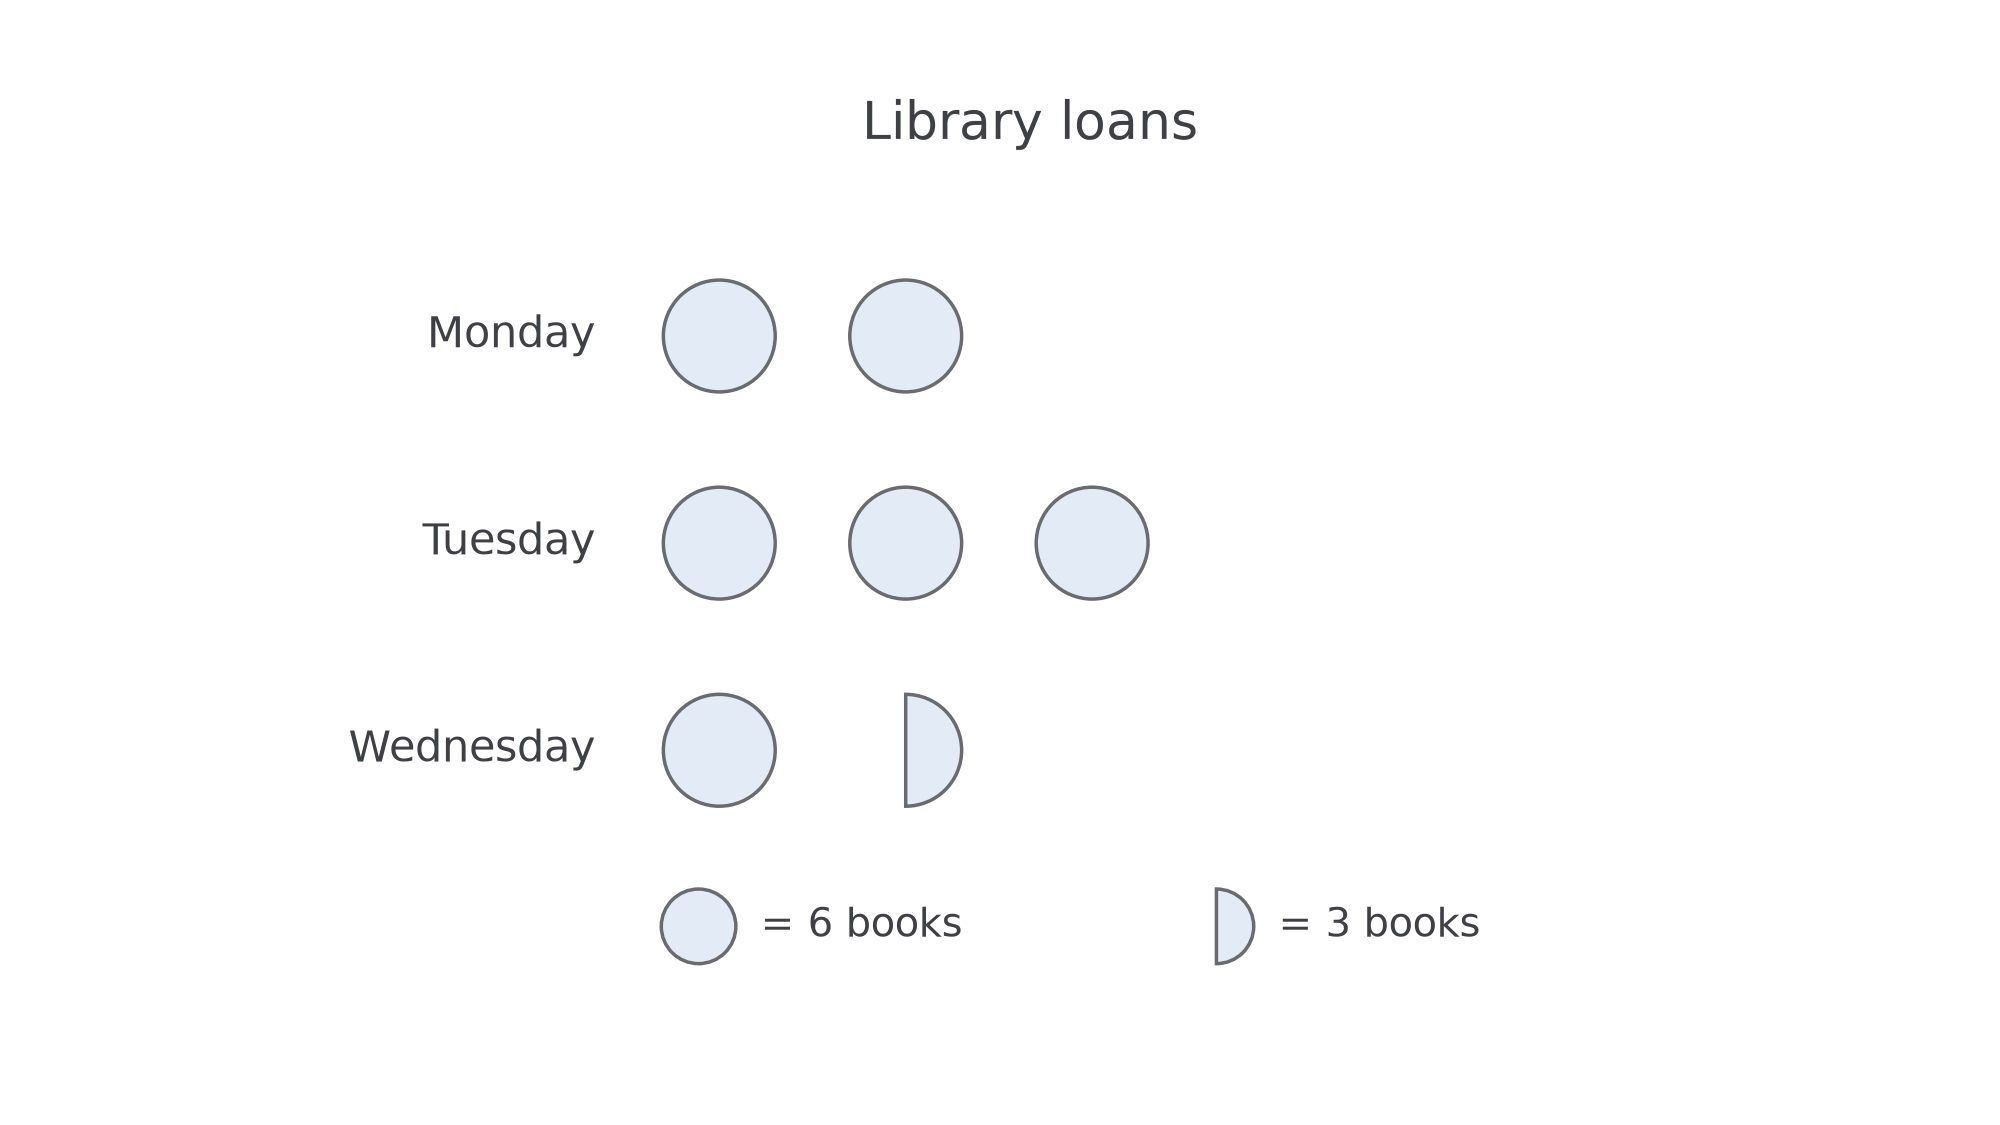
Plan. Convert each row to books before adding or subtracting.
Why use the key first? The symbols count groups of books, not individual books.
Answer. There are loans altogether; Tuesday has more than Wednesday.
Check. The symbols together represent books.
Keep the library frequencies fixed but change only the key: one full circle now represents books. More symbols are needed for the same observations.
Worked example 4: construct rows with a new key
Question. Redraw Monday , Tuesday and Wednesday loans, using one full circle for books.
Plan. Divide each frequency by , then draw that many equal-size circles.
Why divide? Each new symbol stands for a group of books.
Answer. Draw the three labelled rows with equal-size circles and state the key of books per circle.
Check. Multiplying by recovers ; changing the key has not changed the loans.
With the earlier key of , Thursday , Friday and Saturday loans would require , and symbols. A half circle represents books exactly.
A pictogram suits small categorical counts. A bar chart is often clearer if the key would require awkward fractions.
Watch out
The line ignores the key. With this key, books.
Read the whole key in a paper question; its value can change from one pictogram to another.
Bar charts and categorical comparisons
A bar chart compares separate categories by the heights of equal-width bars.
Continue this lesson.
You’re previewing NovaLearn without an account. Create a free account to read the rest.
Create free account