MR8 - Choosing distributions and the normal approximation
A count can have a positive probability at one integer, while a continuous Normal variable has probability zero at every single value. How can the second model approximate the first? In MR8 you will judge Normal models by their shape and use continuity correction to turn integer events into areas.
Shape and support determine model suitability
How can a Normal curve approximate a positive probability at one count when its probability at one point is zero? Consider sixty independent fair coin tosses. Exactly thirty heads has probability about , yet a continuous Normal variable satisfies . The answer will be an area around thirty, rather than the point itself.
You already know
A binomial variable counts successes in a fixed number of independent binary trials with common probability. A Normal variable has a symmetric, unimodal bell-shaped distribution, and probability is area under its curve.
Before finding an area, ask whether one Normal curve represents the distribution sensibly. A roughly symmetric, bell-shaped histogram of a continuous measurement supports it. A long right tail or two separate peaks gives evidence against it. The measurement's physical range matters too: impossible-value tails must be negligible for the task.
Suitable Normal model
A Normal model is suitable when its symmetric bell shape and range of likely values represent the variable adequately for the question being asked. For example, a roughly symmetric distribution of adult heights may support it. A strongly skewed waiting-time distribution is a poor match to one symmetric curve.
A binomial count remains discrete, but a near-symmetric bell-shaped count distribution may be approximated by a Normal curve. Compare these two distributions. They have the same number of trials, but very different shapes.
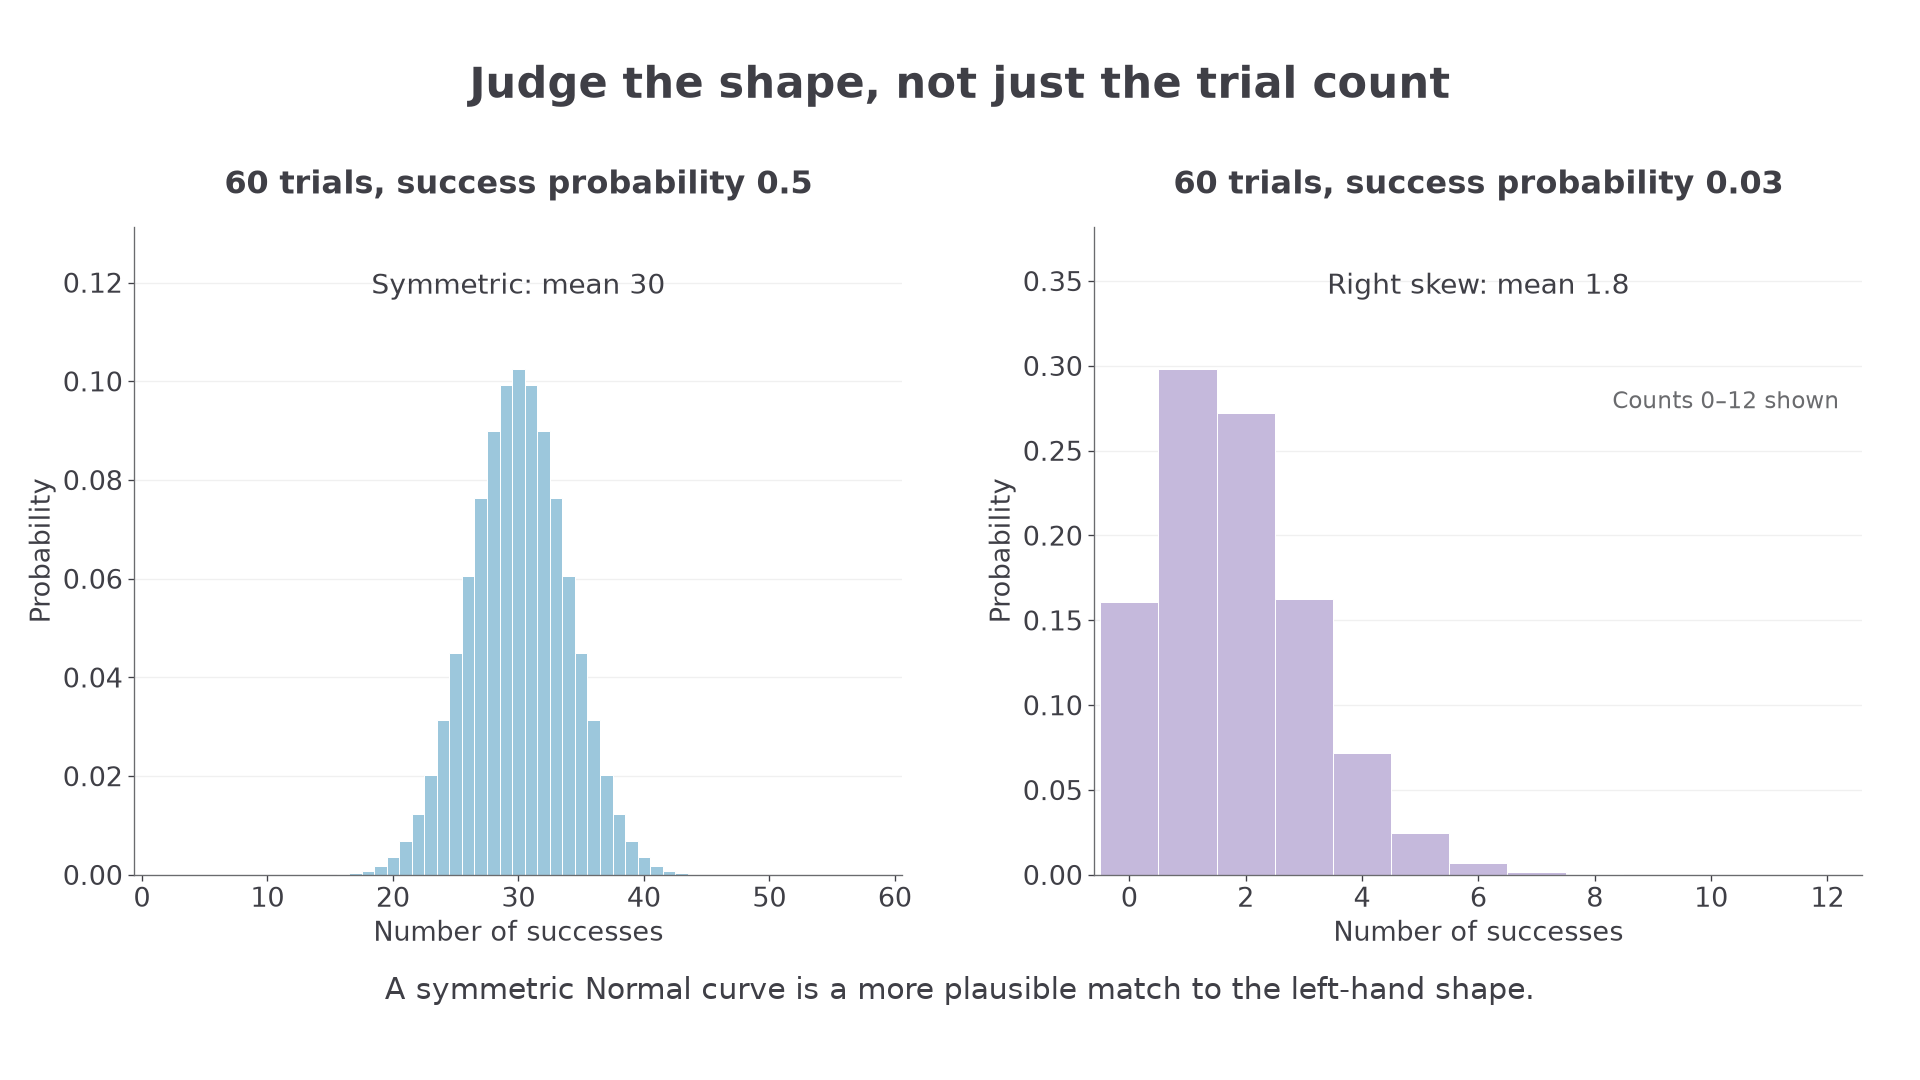
Sixty trials do not settle the choice: one distribution is symmetric, while the other is crowded against zero.
For , a supplied matching approximation is . The second parameter is variance, so the standard deviation is . The count boundaries and are each about standard deviations from the mean; the shape and remote boundaries support the approximation.
For , the supplied mean and standard deviation are and approximately . The distribution is right skewed and close to its lower boundary. A symmetric curve would spill into negative counts near its centre. Changing only the success probability can therefore undermine the approximation.
MEI asks you to recognise this from the shape, not to memorise numerical conditions involving the binomial parameters. In this lesson the matching Normal parameters are supplied; the variance formula for a binomial is not printed on the MEI formula sheet.
Key idea
A continuity correction aligns integer events with continuous areas; it cannot repair a badly matched shape, dependence or incorrect parameters.
That distinction also applies to mixtures. Combining two groups can create two peaks even if each group separately looks Normal.
Give each integer count a unit-width interval
Give each integer its own interval of width one. Then a probability at one count can be represented by an area.
For count , draw a bar from to , with height . Its width is one, so its area equals that probability. The neighbouring bars meet at half-integers. A smooth curve approximates their areas, not their heights at isolated points.
Continuity correction
A continuity correction replaces a set of integer values by the continuous interval covering their unit-width bars. Count occupies the interval from to . For example, corresponds to , rather than .
The picture shades every bar for counts twenty through twenty-four, so the two outside edges are and .
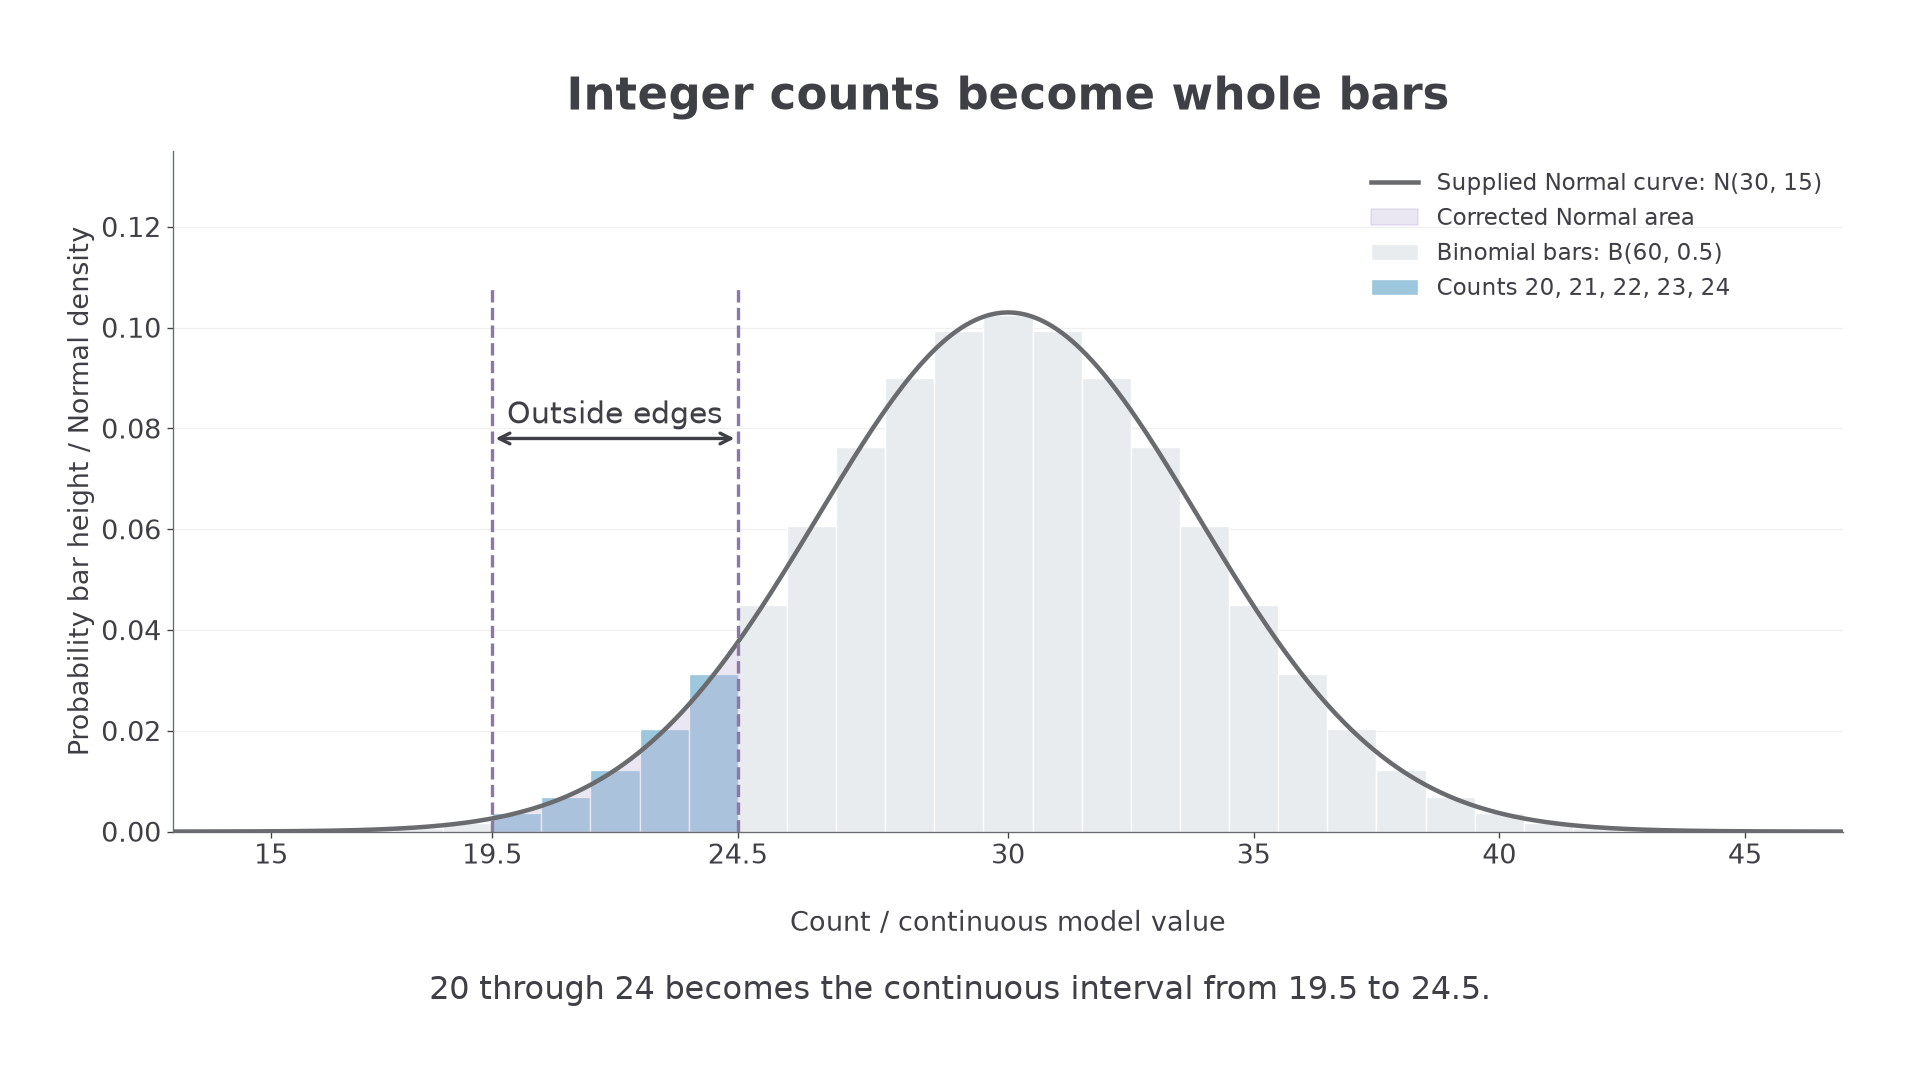
Include whole bars at the boundary counts. The smooth area between the outside edges approximates their total probability.
Continuity-corrected boundaries
If integer-valued is modelled by continuous Normal variable , then for integers ,
First identify the included integers. For , using strict or non-strict endpoints gives the same probability.
Not in the formula sheet: learn it.
Here are the boundary choices for one cutoff. In each row, find the last or first included integer before moving half a unit outwards.
| Integer event | Continuous event |
|---|---|
Worked example 1: one count becomes one bar
Question. An integer count has a supplied Normal approximation . Write the continuous event used to approximate , and explain its boundaries.
Plan. Use the two half-integer edges of the bar centred on .
Why use an interval? A single point has zero area under a continuous curve; a unit-width interval can represent the positive probability of the count.
Answer. Use .
Check. The interval has width one and centre , so it includes exactly the bar we want.
Continue this lesson.
You’re previewing NovaLearn without an account. Create a free account to read the rest.
Create free account