MD6–MD8 - Scatter diagrams, regression and correlation
Use supplied straight and curved best-fit models in MD6, recognise distinct groups and outliers in MD7, and describe correlation without assuming causation in MD8. You will work with the current health large data set and see why pooling different groups can change a scatter diagram's message.
Reading relationships in paired data
Could two groups each have an increasing trend, while their pooled scatter seems to fall? A short, slow hill route and a longer, faster flat route can make that happen.
You already know
A plotted pair belongs to one observational unit. In the LDS, height and upper-arm length in the first record belong to the same person.
The current LDS9 contains 200 people aged 16 and over from the American NHANES survey of 2003–04. These are individual survey records, unlike counts for whole areas. Keep the two selected columns paired by row; sorting either column alone would create different people mathematically.
Association and correlation
Bivariate data record two variables for each individual or object. An association is a relationship between them. Correlation describes a linear relationship: positive when larger values tend to occur together, negative when larger values tend to accompany smaller ones. Strong correlation has little scatter about a straight line; weak correlation has more.
In the real LDS, height and upper-arm length show a positive association. “Tend to” matters: a taller individual need not have a longer upper arm than every shorter individual. A steep gradient does not make a relationship strong: converting centimetres to metres changes the gradient, but not the tightness of the cloud.
A curved association can be pronounced while linear correlation is weak or absent. No apparent linear correlation does not establish independence. Judge the picture before choosing a model; numerical correlation coefficients and their inference are developed later.
Key idea
Describe direction and strength separately, in context. A gradient measures change of units; correlation describes a pattern of paired observations.
Identify the statement that keeps those jobs separate.
Subgroups and unusual paired observations
Look for different sections of the population before committing to a single pooled description.
The left panel uses constructed cycle journeys to make the reversal visible; the right panel uses real LDS height and upper-arm measurements. The datasets are separate, as their labels and units show.
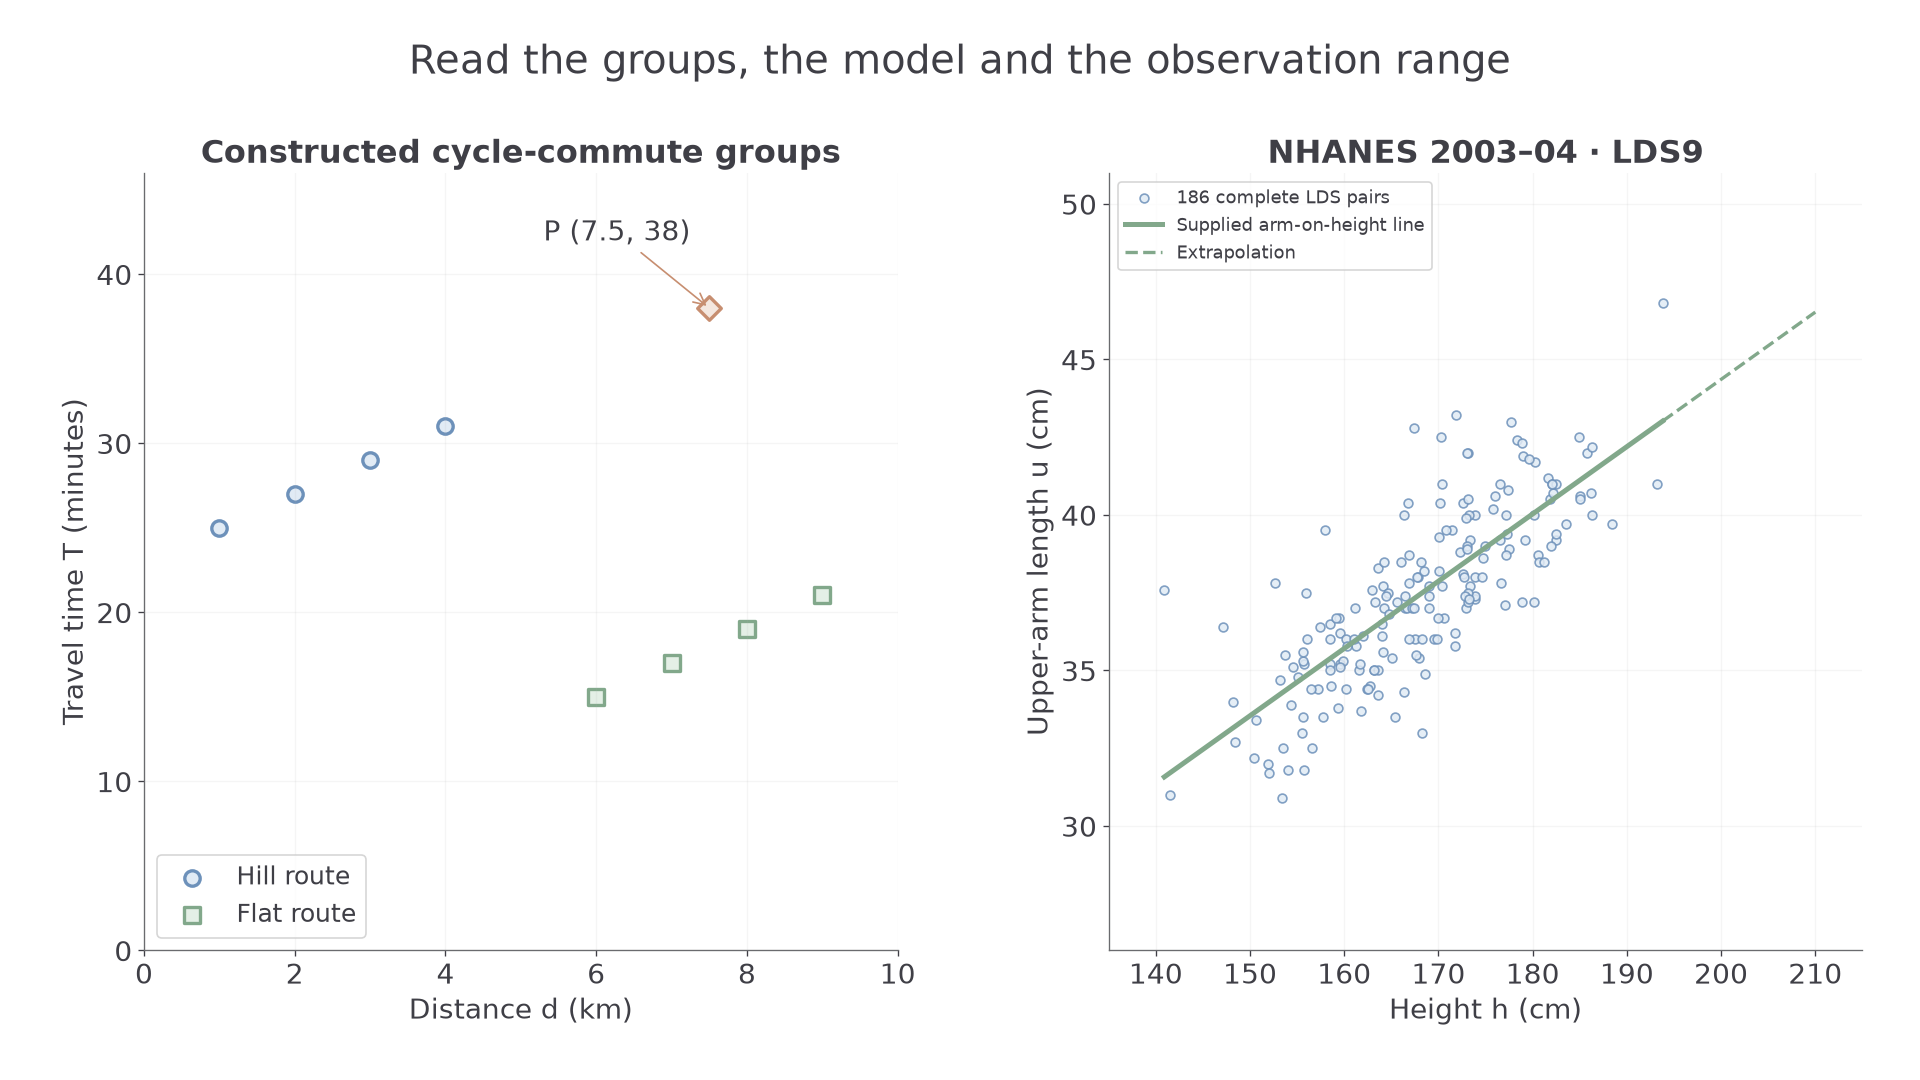
Within each route group, time increases with distance, while longer flat-route trips tend to be quicker than shorter hill-route trips. Point P at is inconsistent with the nearby flat-route trend. It might involve a stop or a recording issue; the picture alone cannot identify its cause.
Scatter outlier
An outlier in a scatter diagram is an item inconsistent with the rest of the paired data. Judge it by eye against the relevant pattern or subgroup, rather than applying a single-variable cutoff to one coordinate.
An extreme height is not automatically a paired outlier if its arm length follows the cloud. An unusual record should be investigated, not removed merely to improve a fitted line.
Worked example 1: separating two sections
Question. Constructed hill journeys have ; flat journeys have . Describe the within-group and between-group patterns.
Plan. Compare successive changes within each route type, then the positions of the groups.
Why keep route types visible? Route conditions differ along with the distance ranges.
Answer. Each group has increasing time with distance, but the longer flat journeys are quicker than the hill journeys. A pooled downward tendency would hide those positive within-group relationships.
Check. The next time increment in both groups is also 2 minutes.
Change only the flat group's times by adding 16 minutes throughout. This preserves its internal trend.
Worked example 2: moving one group
Question. Keep the hill points above, but use flat points . Describe the within-group and between-group patterns.
Plan. Check the new group positions while retaining the same within-group comparisons.
Why does pooling now tell a different story? The vertical position of a group affects the overall cloud even when its own gradient stays fixed.
Answer. Both groups still show increasing time with distance, and the longer flat journeys now also take longer than the hill journeys. Overall and within-group directions agree.
Check. Each flat time rose by 16 minutes; every within-group difference stayed unchanged.
A vertical boundary around separates the pictured route groups without cutting through either. To add a supplied point , follow the distance and time scales to their intersection. Preserve the supplied axes when making additions; numerical regression fitting is not required here.
Watch out
Wrong: “Delete the outlier because the line then looks better.” Check the source and whether the item belongs to the intended population. A valid unusual record can be important evidence.
A new pair of groups tests the same interpretation.
Using a supplied regression line
A regression line supplies predictions in a particular direction; an answer from its equation still needs a range and population check.
For the 186 LDS records with both height and upper-arm length available, software gives the line
with both measurements in cm. Observed heights range from to . The extra digits avoid premature rounding; report predictions below to one decimal place.
Interpolation, extrapolation and residual
Interpolation predicts within the observed input range; extrapolation predicts beyond it. A residual is observed response minus predicted response. The line of on predicts upper-arm length from height, not automatically height from upper-arm length.
The gradient predicts about extra upper-arm length per extra centimetre of height. The intercept is a mathematical prediction at height zero, far outside the observed range; it is not a meaningful human measurement. Rearranging the line does not turn it into the regression of height on arm length.
Using a supplied line
For a line predicting from :
Do not calculate a regression equation from data or summary statistics for this lesson: use the supplied model.
Not in the formula sheet: learn it.
For example, the first LDS person's gives prediction about ; the observed has residual about . A negative residual places that point below the line.
Continue this lesson.
You’re previewing NovaLearn without an account. Create a free account to read the rest.
Create free account