Mp21–Mp25 - Samples, random sampling and bias
Learn how samples support uncertain conclusions about populations, and how to implement and evaluate different selection methods. You will distinguish equal individual chances from simple random sampling, and see why a large health survey can still answer the wrong question.
Populations, samples and uncertain conclusions
Could 400 patients attending a practice's exercise classes give a worse estimate of all its adult patients' resting pulse rates than 60 patients selected from its complete adult register? The first survey has more people, but it may mostly reach the physically active. The population you want and the people you can reach are different things.
You already know
A mean describes a centre; variation describes how spread out observations are. A proportion compares a relevant count with its total. For example, 28 cyclists in 80 commuters give , or , of that sample. The proportion calculation is not in the formula sheet.
Define the group of interest before deciding how to collect observations. In a hospital survey, “all employees” includes different people from “all employees working the day shift”.
Population, sample and sampling unit
The population is the complete collection of individuals or items of interest in an investigation. A sample is a collection selected from it. The sampling unit is one selected individual or item. If 60 of a hospital's 1,200 employees are surveyed, the employees form the population and one employee is a unit; the 60 surveyed employees form the sample.
A population may be finite, such as all adult patients currently registered at one practice, or infinite, such as all possible tosses of a particular coin. A sample of ten tosses is finite even when the population of possible tosses is infinite.
A sampling frame is the list or other source used for selection. A practice register may cover all its patients, but it is not a list of everyone living locally. An incomplete frame can omit people before any random selection begins.
A census attempts to obtain information from every member of the defined population. It can be costly, slow or impossible; testing every manufactured item to destruction would consume the population. A census can also contain missing or inaccurate responses. “More complete” does not mean “error-free”.
The MEI large data set for June 2027 is different from a census: LDS9 contains records for a random sample of 200 individuals aged 16 or over from the United States' NHANES 2003–04 survey. Each row represents a person. Observing all 200 rows describes the workbook's records, not every American. A further sample of its rows is a sample from those 200 records, not a newly collected national sample. Missing measurements still need attention.
Sample summaries support informal inferences: estimates of population features, accompanied by uncertainty. The sample mean estimates a population mean; the sample variance estimates a population variance. Variance measures spread in squared units; its calculation is taught later. Here, use the supplied summaries.
Worked example 1: infer centre and spread
Question. A simple random sample of 40 adult patients from a practice has mean resting pulse and variance . Give informal estimates for the practice's adult population and state a limitation.
Plan. Match each sample summary to the corresponding population feature, keeping the target population explicit.
Why retain the population description? The frame concerns this practice's adult patients, not all adults everywhere.
Answer. The sample suggests a population mean near and variance near . Another sample may give different estimates, even with the same sound random procedure.
Check. The mean keeps the pulse-rate units; variance has squared units and is non-negative.
Now change the realised sample, keeping its size, population and random procedure fixed. Its centre and spread can both change: this is sampling variation.
Worked example 2: two samples, two conclusions
Question. Another random sample of 40 adult patients has mean and variance . Does this establish that the practice's population has changed?
Plan. Compare the summaries, then distinguish variation between samples from a change in the population.
Why are two different summaries possible? The selected patients differ, so their pulse rates can have a different centre and spread without any population change.
Answer. The second sample suggests a mean near and variance near . It does not, by itself, establish a change in either population feature.
Check. Both sample sizes are 40; the changed conclusions cannot simply be attributed to a changed sample size.
Larger well-selected samples generally reduce sampling variation. They do not automatically remove bias from missing groups, refusals or unsuitable measurements. These sampling definitions and inference principles are not printed in the formula sheet: learn their meanings.
Watch out
Wrong: “A sample variance of proves that the population variance is .” Correct: the observed variance is an estimate of the population variance. Random samples can give different estimates.
Use the supplied summaries for a new sample; no variance calculation is required.
Selecting a simple random sample
A random-looking collection is not enough: the selection mechanism must give the required samples equal chances.
Simple random sample
For sampling without replacement, a simple random sample of a specified size gives every possible sample of that size the same probability of selection. Uniformly choosing distinct labels from a complete frame achieves this; choosing one intact equal-sized class at random does not generally produce a simple random sample of students.
Consider just four people, , , and . A fair coin selects the intact pair or . Each person has probability of selection, but four possible pairs are impossible. Equal inclusion chances for individuals are weaker than equal chances for all samples of the required size.
[DIAGRAM: asset_name: Equal individual chances do not make every pair possible; asset_slug: h640_sampling_pairs; caption: Each person has a one-half inclusion chance, but the rule cannot select AC, AD, BC or BD; description: Six two-person samples AB, AC, AD, BC, BD and CD are shown. Only AB and CD can be selected by the fair-coin rule, each with chance one-half; the other four have chance zero. Every person belongs to exactly one selectable pair, exposing the difference between individual inclusion chances and simple random sampling.]
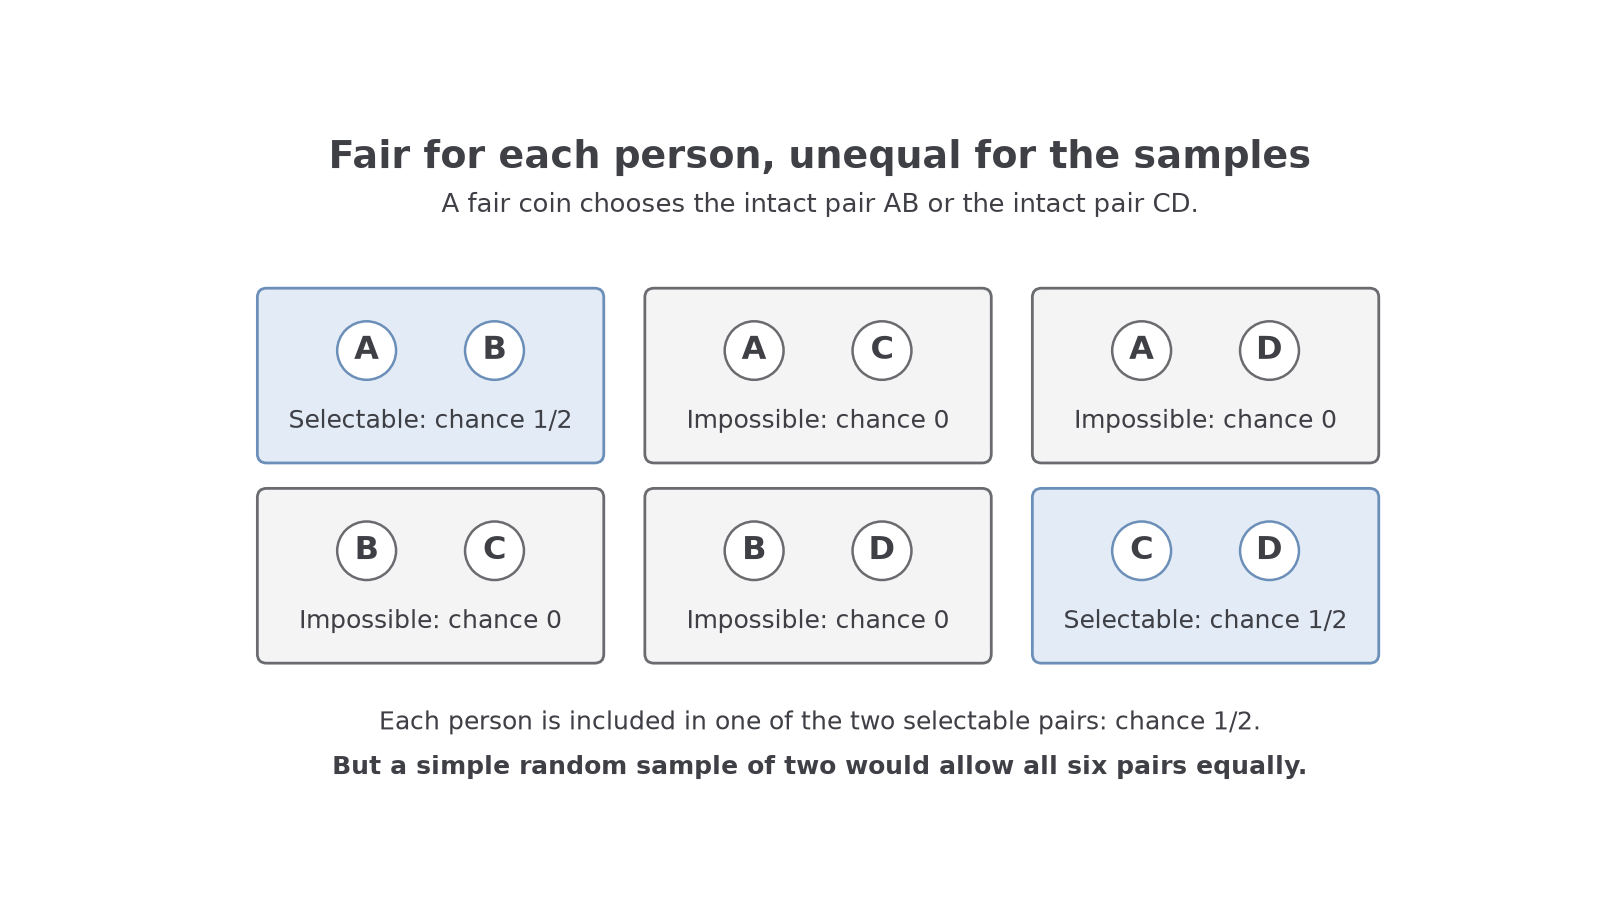
For a finite survey of people, sampling without replacement avoids selecting the same person twice. If sampling with replacement is explicitly specified, return the selected unit to the frame before the next random draw, so repeats are possible. These are different finite-population designs. For an infinite population, such as all possible tosses of a coin, the with/without-replacement distinction does not affect sampling.
For a list of 240 people, a without-replacement sample of 12 can be selected by assigning unique labels 001–240 and reading uniform random outputs until 12 distinct valid labels survive. Reject invalid labels and duplicates; do not replace them with convenient choices.
You can practise the mechanism on the 200 LDS9 records by assigning labels 001–200 in row order. This selects records from that finite frame; it does not alter how NHANES originally recruited people.
Worked example 3: random selection without replacement
Question. Select four of the 200 LDS9 records without replacement using the uniform random outputs 014, 205, 014, 137, 000, 052, 188, 073.
Plan. Read from left to right, rejecting outputs outside 001–200 and labels already selected.
| Output | Decision | Reason |
|---|---|---|
| 014 | Select | Valid new record |
| 205 | Reject | Outside the frame |
| 014 | Reject | Record already selected |
| 137 | Select | Valid new record |
| 000 | Reject | Outside the frame |
| 052 | Select | Valid new record |
| 188 | Select and stop | Fourth distinct valid record |
Why reject the second 014? It is the same record, so retaining it would not give four different sampled individuals.
Answer. Select records 014, 137, 052 and 188.
Check. The four labels are distinct and all lie in 001–200; 073 is not needed.
Change only the replacement rule. The frame and random outputs stay the same, but a repeat can now be retained.
Worked example 4: random draws with replacement
Question. Instead make four random draws with replacement from the 200 records, using 014, 205, 014, 137, 000, 052, 188, 073. State the retained labels.
Plan. Continue rejecting out-of-range labels, but allow a selected record to appear again.
| Retained draw | Reason |
|---|---|
| 014 | In the frame |
| 014 | Repetition is now allowed; 205 was invalid |
| 137 | In the frame |
| 052 | In the frame; 000 was invalid |
Why keep the duplicate now? Replacing a selected record restores the whole frame for the next draw.
Answer. The draws are 014, 014, 137 and 052. They contain only three different records, which is permitted by this replacement rule.
Check. There are four accepted draws. None lies outside 001–200.
A random choice does not guarantee a representative realised sample. It also does not prevent non-response bias if selected people who decline differ systematically from those replying. Plan repeat contact attempts and any random replacement procedure before collecting answers; do not quietly substitute friends.
Exam tip
Explain why a design fails the definition: identify unequal selection chances or a possible sample that the rule cannot produce. A method name alone does not establish the reason.
Return to the usual survey rule, without replacement, on a new frame.
Recognising methods and their tradeoffs
You need to be able to carry out different sampling methods, not just recognise their names. First decide whether selection uses random labels, a regular interval, whole groups or whoever is available.
Sampling groups
Strata are non-overlapping groups that together cover the population; a stratified random sample selects people randomly within every chosen stratum. Clusters are intact groups selected as units, with all their members surveyed in the basic cluster design. Sampling some people from every shift is stratified; randomly choosing whole shifts and surveying everyone in them is cluster sampling.
Here is how to implement each of the other named methods.
Continue this lesson.
You’re previewing NovaLearn without an account. Create a free account to read the rest.
Create free account