MH10, MH11 - Correlation coefficients and significance tests
Two coefficients can describe the same pairs differently because they measure different features. MH10 develops linear and rank correlation; MH11 uses supplied critical values and explained software probabilities to make cautious population inferences about the relationship actually being investigated.
Linear correlation and rank correlation
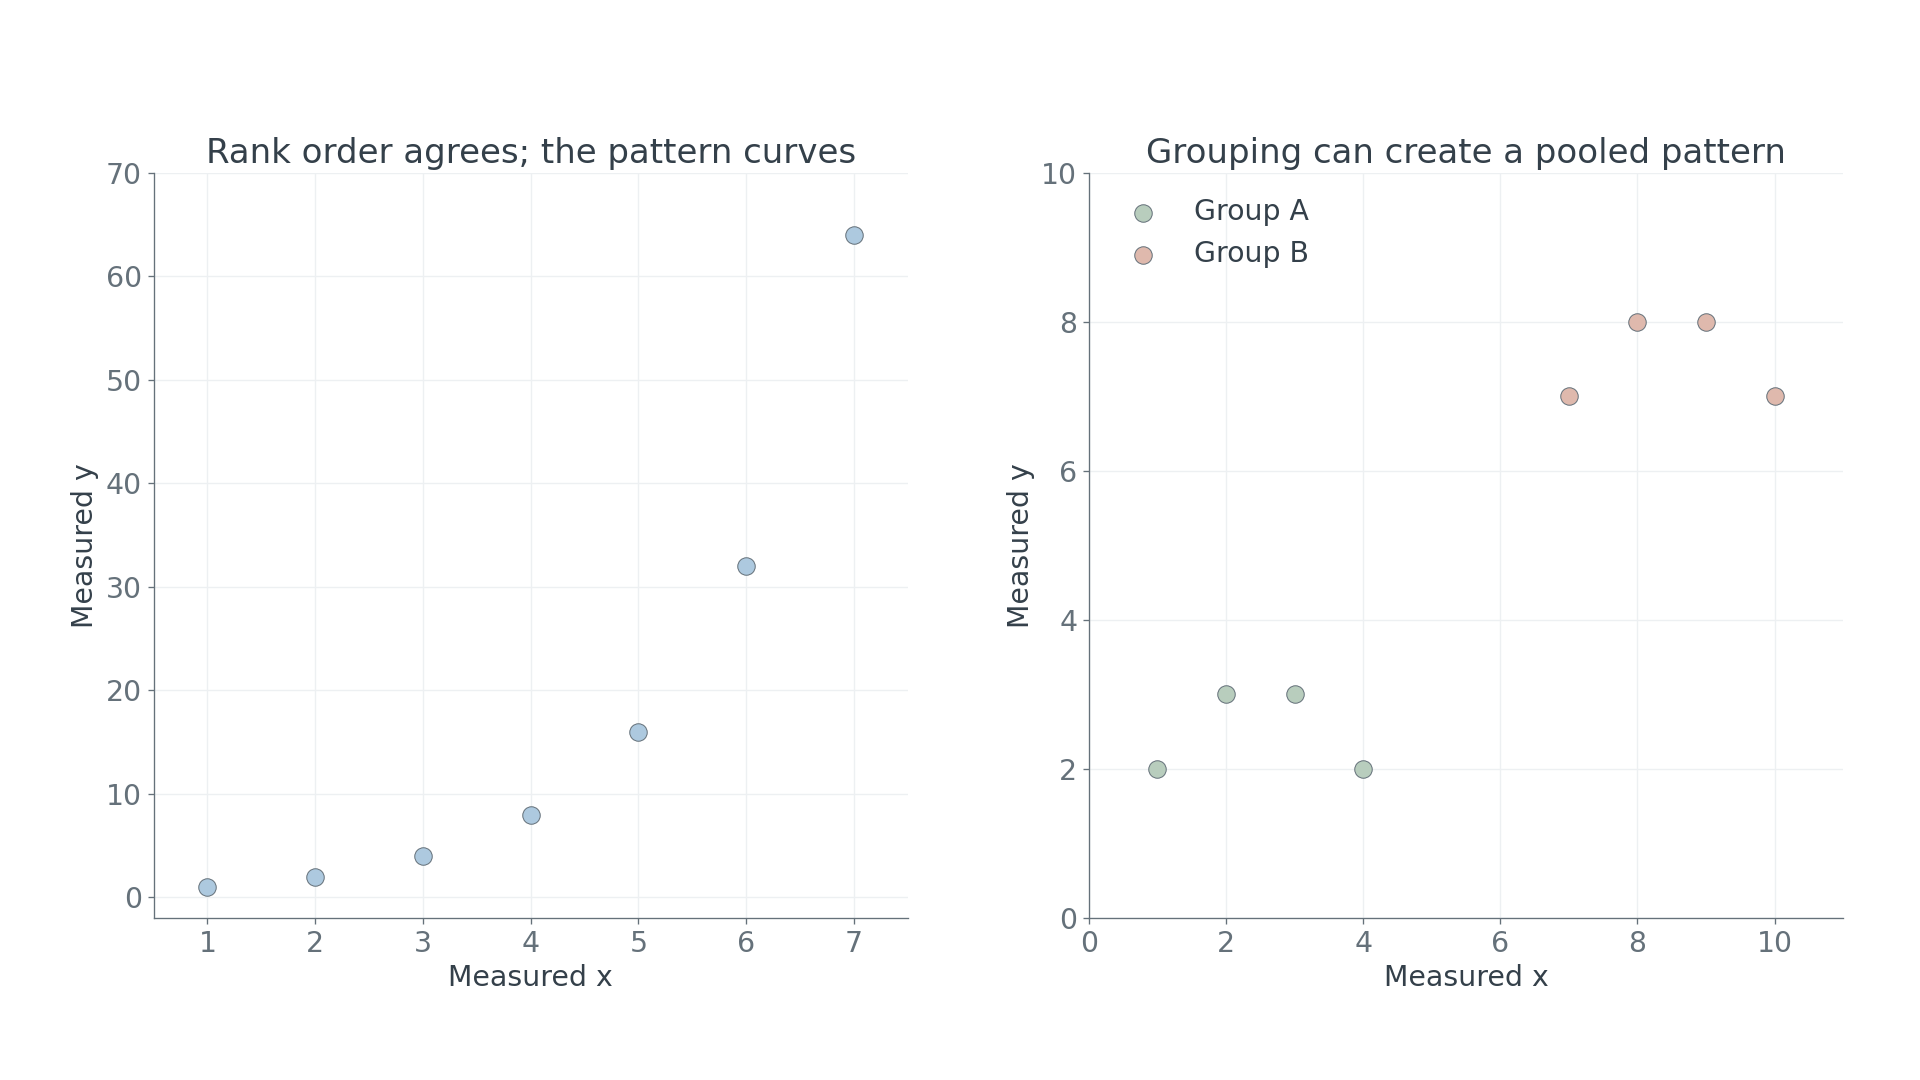
Can two variables have perfect rank agreement without lying on a straight line? Consider the pairs below. Every step to the right goes upwards, but the jumps in height keep growing.
Software supplies rank coefficient and linear coefficient approximately . Both are correct. The ranks agree exactly, while the actual values follow a curve. Perfect ordering need not mean a perfect straight line.
You already know
A scatter diagram uses one point for each pair of values. Positive patterns rise from left to right; negative ones fall. Ranking replaces numerical distances by positions in an ordered list.
The left panel shows this distinction. Keep an eye on the right panel too: later we will ask whether an overall pattern describes either group separately.
Linear correlation coefficient
A linear correlation coefficient, written for a sample, measures how close paired data lie to a straight line. It lies between and . The sign gives direction; a magnitude nearer describes closer agreement with a straight line.
A supplied value describes a fairly strong downward linear pattern; describes little linear correlation. The coefficient is dimensionless and is not the gradient. Varying points all on have linear coefficient , not . If one variable is constant, the usual coefficient is undefined.
Rank correlation coefficient
A rank correlation coefficient measures correlation between the ranks of paired data values, rather than the actual values. Positive rank correlation means that higher-ranked values of one quantity tend to accompany higher-ranked values of the other; negative rank correlation means the ordering tends to reverse.
Ranks retain order and discard numerical spacing. When values tie, use the supplied explanation of how the software handles equal ranks. A steadily increasing curved relationship can have strong rank correlation while its linear coefficient is smaller. Rank correlation can describe broader association, but it does not capture every possible relationship. For example, the symmetric pairs , , have zero linear correlation and zero rank correlation even though they follow an exact rule.
These interpretations and coefficient properties are not in the formula sheet: learn them. You do not need names of particular coefficients or calculation formulas. Technology supplies values from paired columns; your job is to understand what the selected output measures.
Key idea
A linear coefficient measures straight-line closeness; a rank coefficient measures agreement of order. Neither is a general detector of every possible relationship.
The next pair of outputs asks you to recognise that difference without calculating either coefficient.
The population relationship being tested
A nonzero sample coefficient is a description of the sample; a hypothesis test asks whether there is evidence of a relationship in the population.
You already know
The null hypothesis supplies the model against which the evidence is judged. A significance level is chosen before the sample result is examined. Non-rejection means insufficient evidence for the alternative, rather than proof of the null.
Read the question's wording carefully. Correlation here concerns a straight-line relationship; association can mean a more general relationship. The question supplies an appropriate coefficient and indicates which relationship it is testing. Do not silently replace an association conclusion with a claim specifically about a straight line.
Population hypotheses for correlation or association
A correlation test has null hypothesis of no population linear correlation. If denotes population linear correlation, write . An association test has null hypothesis of no population association, stated in words when appropriate. The alternative must match the direction, or either direction, specified by the investigation.
The hypotheses and their interpretation are not in the formula sheet: learn them. The following examples keep the population and measured quantities fixed while changing the kind of relationship the supplied test investigates.
Worked example 1: a linear-correlation question
Question. An independent random sample of mature trees is used to investigate linear correlation between tree height and canopy width in either direction. State suitable hypotheses, defining any population parameter.
Plan. Define population linear correlation, then use a zero null and a two-sided alternative.
Why this step? The unknown quantity belongs to the population. Writing a hypothesis about the supplied sample would test a value already observed.
Answer. Use these population hypotheses for the supplied linear-correlation test.
Check. A pre-stated positive claim would instead use ; a negative claim would use . The sample sign cannot choose that claim afterwards.
Change only the target relationship: the same tree investigation now uses an appropriate supplied rank test for broader association in either direction. That change needs association wording rather than a linear parameter.
Worked example 2: an association question
Question. For the same population and random sampling design, an appropriate rank test investigates association between height and canopy width in either direction. State the hypotheses in words.
Plan. State absence of the relationship as the null, and presence of that relationship as the alternative.
Why this step? The supplied test addresses association. A statement only about straight-line correlation would change the question.
Answer. Test no association against association in the population of mature trees.
Check. Both hypotheses concern the same two quantities and the same population; neither claims that one variable causes the other.
These correlation applications use data where both variables are random: choosing a random tree supplies a height–width pair. Different sampled members should provide independent pairs. Pairing one tree's height with deliberately set monthly times is different: time is fixed by the design, and repeated readings on one tree do not provide independent sampled tree pairs.
Watch out
Wrong: choose a positive alternative because the sample coefficient is positive. Right: choose the relationship and direction from the question before examining the output, then use the matching supplied calibration.
The next investigation changes the measured quantities. Keep the population wording and the random-variable condition clear.
Interpreting critical values and software significance
A coefficient describes the sample pattern; its matching p-value or critical value provides evidence for a population decision.
Suppose software labels a coefficient “Rank r”, a probability “Sig. (2-tailed)” and the complete-pair count “N”. The question explains that “Sig. (2-tailed)” is the two-sided p-value. Use that explanation, rather than guessing from the software's notation.
p-value
Assuming the null model is true, the p-value is the probability of a test statistic at least as extreme as the observed statistic in the direction or directions of the alternative. It is not the probability that the null is true and is not another correlation coefficient.
A 5% significance level is , not , in a comparison with a probability.
Using a supplied p-value
For significance level ,
The p-value must match the stated test and alternative. Not in the formula sheet: learn it.
An independent random sample of six shops provides paired stock-turnover and waste-mass observations. The following output is from an appropriate rank test for population association in either direction. The probability is calibrated for this test, including its small sample size.
| Software field | Supplied output |
|---|---|
| Rank r | |
| Sig. (2-tailed), meaning two-sided p-value | |
| N, meaning complete paired observations |
Continue this lesson.
You’re previewing NovaLearn without an account. Create a free account to read the rest.
Create free account