2b, 2c - Exploring the 2027 large data set
Use the prescribed LDS9 health data to build an enquiry you can defend: understand the measurements, select relevant complete rows, and use software summaries and graphs. You will compare repeated samples with the full available data and interpret a supplied simulation test without treating a historical sample as today's population.
LDS9 is a historical sample of people
Why does a person with systolic readings , and have a supplied average of , rather than ? The answer is in the measurement rule, not a mysterious new way to add. This is the first real person in the workbook, and the rule will matter whenever you analyse its blood-pressure columns.
You already know
A mean adds the included measurements and divides by their number. A sample and its target population are different things; the selection, place and time affect the conclusions you can draw.
For the H640 June examination, the prescribed resource is LDS9, with its student notes and source information. It contains a random sample of people aged or over from the American National Health and Nutrition Examination Survey, NHANES, in –. Read the Information sheet. These public-domain survey data were downloaded for the resource in . LDS10 belongs to later H640 examinations, not June .
One Data row is one person. Age is in years; Weight is in kg; Height, waist and limb lengths are in cm; Pulse counts beats over seconds; blood pressures are in mmHg. Sex, Marital, Food30 and Arm are categorical fields. Marital categories have no numerical rank that would justify calculating a correlation from arbitrary category numbers.
Recorded measurement and derived variable
A recorded measurement is an observed value, such as height. A derived variable is calculated from other measurements, such as a mean blood pressure or BMI. Its definition determines which inputs and units to use.
For example, the first person's mass and height give BMI , agreeing with the supplied . BMI uses mass in kg divided by squared height in metres; the centimetre value must be converted. This definition is supplied by the context, not printed in the formula sheet.
For blood pressure, interviewers sought three measurements at least one minute apart, with at most four attempts. The supplied Systolic and Diastolic averages ignore the first reading unless it is the only reading. Here “first reading” means the first successfully recorded measurement: if attempt one is missing, it is not necessarily the first column. Average the remaining recorded readings, not missing attempts. The Data headers misspell the individual diastolic fields as “Disatolic1” to “Disatolic4”; retain those labels when locating source columns, while writing “diastolic” in your conclusions.
Worked example 1: the first person's average
Question. Data row has systolic attempts , with the fourth missing. Determine the average required by the Information sheet.
Plan. Exclude the first reading because later readings exist, then average the two available later values.
Why this step? The first reading is deliberately excluded by the recording protocol; the missing fourth attempt contributes neither a value nor an extra divisor.
Answer. The prescribed systolic average is .
Check. The result lies halfway between the two included readings and matches the supplied Systolic value.
Change only the person in Worked example 2. The measurement protocol and missing-fourth-attempt pattern stay the same.
Worked example 2: another real row
Question. Data row has systolic attempts , with the fourth missing. Determine its prescribed average.
Plan. Apply the same exclusion rule before calculating the mean.
Why this step? A standard spreadsheet average of all three numeric attempts would include a value that this variable's definition excludes.
Answer. The prescribed systolic average is .
Check. It is between and , and agrees with the supplied average.
If only the first reading exists, retain it instead: discarding it would discard the person's only measurement. No blood-pressure averaging protocol or arithmetic-mean formula is printed in the formula sheet; learn to apply the supplied definition.
Watch out
Wrong: the code #N/A means a blood pressure of zero. Right: it means the measurement is unavailable. The code was included specifically to stop software interpreting a blank as zero.
A third real row gives you the same calculation without copying either example.
Complete observations are selected for named variables
Choose the variables before removing unavailable values; a person with a missing arm length can still contribute to an age–blood-pressure enquiry.
Keep the source unchanged. In a working copy, retain the original Data row number as an identifier, and select Age with the measurement you need. A spreadsheet column holds a field, a row holds a person's observations, and a cell such as U2 identifies a particular entry. Delete or exclude a whole selected analysis row when a required member of its pair is missing; never shift individual cells upward, which would pair different people.
For Age against Systolic, original columns B and U must both be numeric. All ages are present, but Systolic values are missing, leaving complete pairs. A missing fourth attempt does not invalidate an available supplied average. Compact the selected pairs into a separate analysis table: merely hiding rows does not make ordinary spreadsheet summary functions ignore them.
MEI sample standard deviation
For numerical observations with mean ,
The sample variance uses divisor , and has the original measurement's units. In the formula sheet.
On a compact table with row containing headers and the selected measurement in column C, use , and on the explicit data range. The letter S in this function is a useful reminder of the sample divisor; check your calculator's output definition rather than guessing from its label.
Worked example 3: summarising the complete systolic data
Question. The complete Age–Systolic pairs have and for Systolic. Determine the mean and sample SD to decimal places.
Plan. Use the selected count for both the mean and the sample-variance calculation.
Why this step? Using would pretend that the missing values were observed. Using inside the final square root would select the wrong MEI SD convention.
Answer. Mean , sample SD .
Check. On a compact -row table, gives ; and reproduce these values.
Change only the blood-pressure variable to Diastolic. Its own data quality determines its selected count; do not carry over the earlier count automatically.
Worked example 4: a variable-specific cleaning decision
Question. For Age–Diastolic, the notes identify an erroneous zero Diastolic value at Data row . After marking that value unavailable and removing missing required pairs, observations give , . Determine their mean and sample SD to decimal places.
Plan. Use the cleaned count and its sample divisor; keep the original workbook and the decision record.
Why this step? The erroneous Diastolic value is a problem for this analysis; it does not erase the same person's available Age or Systolic measurements from other analyses.
Answer. Mean , sample SD .
Check. Copy the selected observations to their own range and check that its count, mean and sample SD agree. Do not average the whole column after just hiding the rejected rows.
The original first complete Age–Systolic pairs are useful spot checks on copying:
| Original Data row | Age, years | Systolic, mmHg |
|---|---|---|
Record your variables, excluded codes or errors, final count and units. A tidy table does not establish representativeness: missingness may relate to health or measurement difficulty.
Exam tip
When explaining cleaning for a paired calculation, refer to complete rows for the required variables. Deleting isolated cells breaks the pairs; deleting every row with any missing field discards usable information.
For a fresh summary, keep Age and change the measured variable to Pulse.
Software graphs and outputs explore relationships
An XY scatter diagram puts one person at each complete Age–Systolic pair, so the horizontal and vertical coordinates must stay together.
Select the two columns in the compact -pair table and insert an XY scatter chart, with Age horizontally and Systolic vertically. Label years and mmHg. Do not use a line chart joining people in workbook order: that order is not elapsed time. A point can coincide with another person's point, so fewer visible dots need not mean fewer observations.
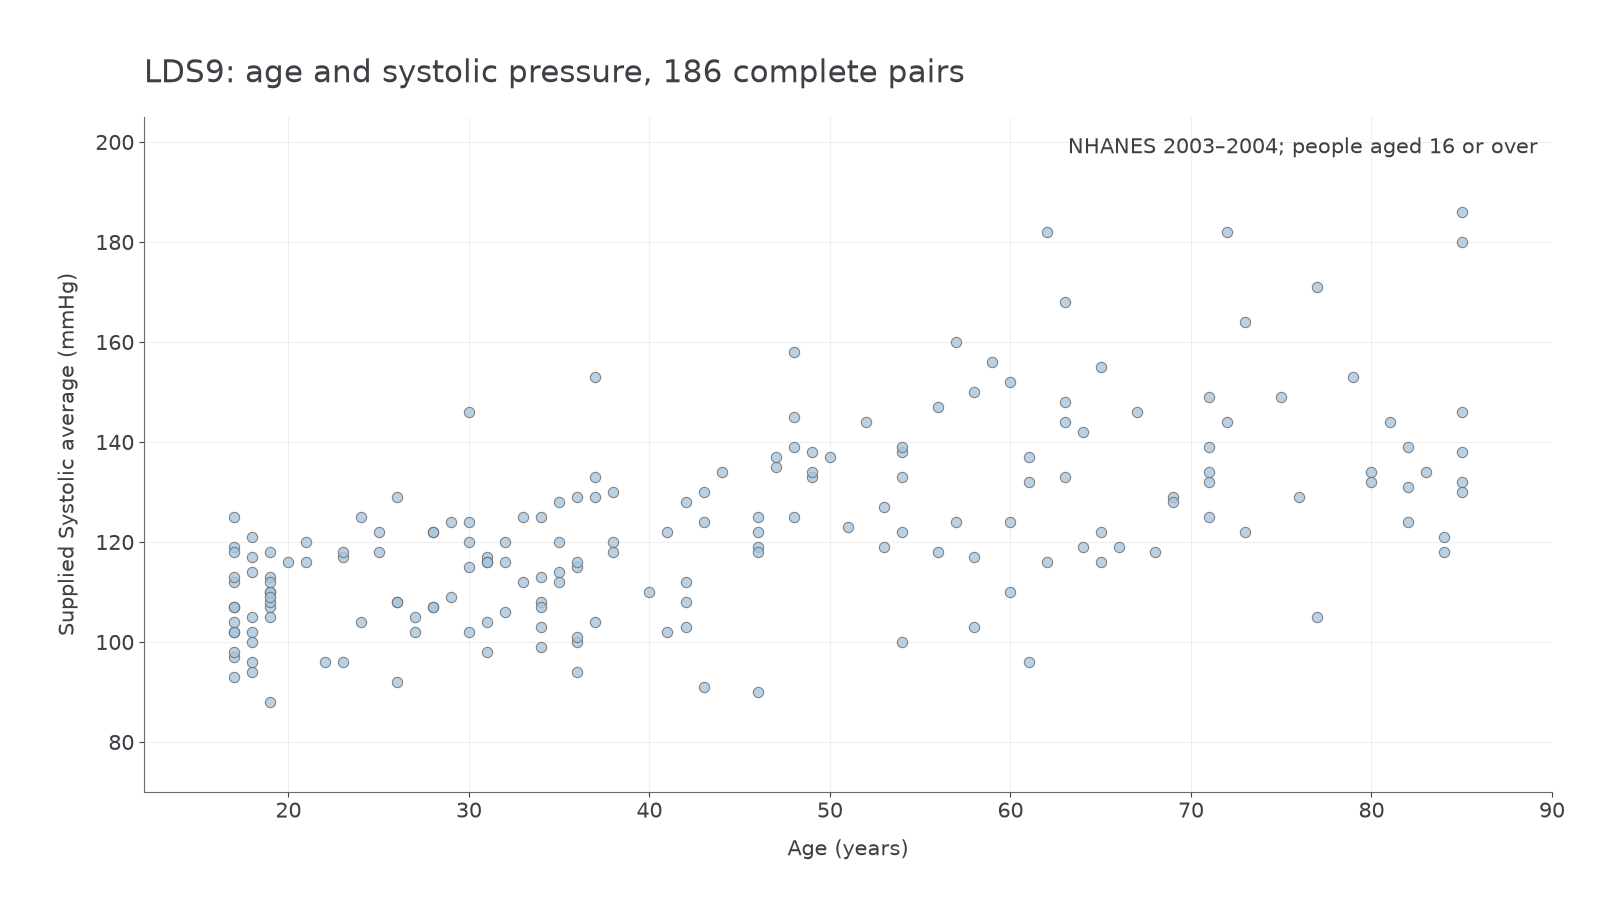
The pattern suggests positive association with considerable variation. On the compact table, gives approximately . This describes linear association in these pairs. It is neither a slope nor a claim that of people have a particular condition. Calculating this coefficient by hand is unnecessary here.
For group comparisons, create separate Sex-group scatter plots with common scales. The available female Systolic values have count , mean and sample SD ; the male values have count , mean and sample SD . The observed female spread is greater, but differences in age composition and missingness may affect the comparison. Use a box plot for median and IQR, a histogram for shape, and a bar chart for categorical counts such as Marital.
Empirical probability model
An empirical probability model uses observed frequencies to assign probabilities under an explicitly stated selection rule. Selecting uniformly from the available Systolic observations gives every one of those people equal probability; it does not select a present-day UK adult.
Choose a numerical threshold as a mathematical event, without turning it into a diagnosis. Count the event and its eligible total using the same cleaned range. The frequency-over-total reasoning is not printed as a separate formula in the formula sheet: learn it.
Continue this lesson.
You’re previewing NovaLearn without an account. Create a free account to read the rest.
Create free account