MR1–MR5 - Binomial models and probabilities
Recognise a binomial situation and choose its success probability (MR1–MR2), then calculate exact and cumulative probabilities (MR3). Use the mean count and expected event frequencies to connect the model with observed batches (MR4–MR5), keeping those two kinds of average distinct.
Define the count and test the trial conditions
A team contacts five people at a time. If each replies with probability 0.4, should most batches contain exactly two replies? The average count and the most common count can agree without either occurring in most batches. A probability model will tell us the difference.
You already know
Independent events have product probabilities, and disjoint alternatives have additive probabilities. Expected frequency is the number of repetitions multiplied by the probability of the event; it describes a long-run average.
Fix a deadline and count replies by that deadline. A person's eventual reply is a different event and may have a different probability.
Binomial distribution
A binomial variable counts successes in fixed, independent trials, each with two exhaustive outcomes and the same success probability . Write , with . The symbol means “has the distribution”. Possible counts are ; success can mean an unwanted outcome as well as a wanted one.
For five contacts, a common reply probability 0.4 and independent replies give . The fixed five contacts and reply/no-reply deadline rule establish two conditions. Common probability and independence are assumptions to assess against the context.
Different levels of familiarity with the team could change between people. Members of one household could discuss the message, linking their replies. Those are different objections: unequal probabilities and dependence. Stopping when the first reply arrives would instead remove the fixed trial number. Sampling without replacement from a small known group of responders and non-responders generally changes the success proportion as selections proceed.
Observed data can suggest . For example, 48 replies from 120 earlier contacts give estimated reply probability . Applying that to a new group assumes comparable people, message and deadline; the estimate does not make 0.4 an exact known population probability.
For a different setting, the 2027 MEI large data set contains 200 NHANES records from people aged 16 or over in the 2003–04 survey. Imagine drawing five records without replacement and counting those aged at least 40. The age threshold gives a binary classification, but selecting a record changes the mix remaining, so the count is generally not exactly binomial. A model for random draws from these records also concerns this historical finite data set; it does not automatically describe people in the United States today.
Key idea
The variable must count successes, and the procedure must support all four trial conditions. A plausible value of alone does not establish a binomial model.
Consider what is still missing when the trial number and success probability are already specified.
Calculate the probability of an exact count
The count two hides several possible reply lists. A combination factor counts every choice of the two people who reply.
Exact binomial probability
For , , and an integer ,
In the formula sheet.
One specified list has product probability by independence. Constant makes this probability the same for all disjoint lists. Their sum gives the formula. Equivalently, all count probabilities appear as the terms of .
Worked example 1: two replies
Question. For , calculate .
Plan. Choose two replying positions and multiply by the probability of each such list.
Why this step? RRNNN is one list, not the complete event “two replies”.
Answer. The probability is 0.3456.
Check. One list has probability 0.03456; ten lists give 0.3456.
Change only the required count, from two replies to three. The number of contacts and reply probability stay fixed.
Worked example 2: three replies
Question. For the same model, calculate .
Plan. Change the success count and complementary failure count together.
Why this step? Both exponents must change so their sum remains five.
Answer. The probability is 0.2304.
Check. Dividing by 0.3456 gives : the combination factors happen to be equal, so replacing a non-reply by a reply supplies this ratio.
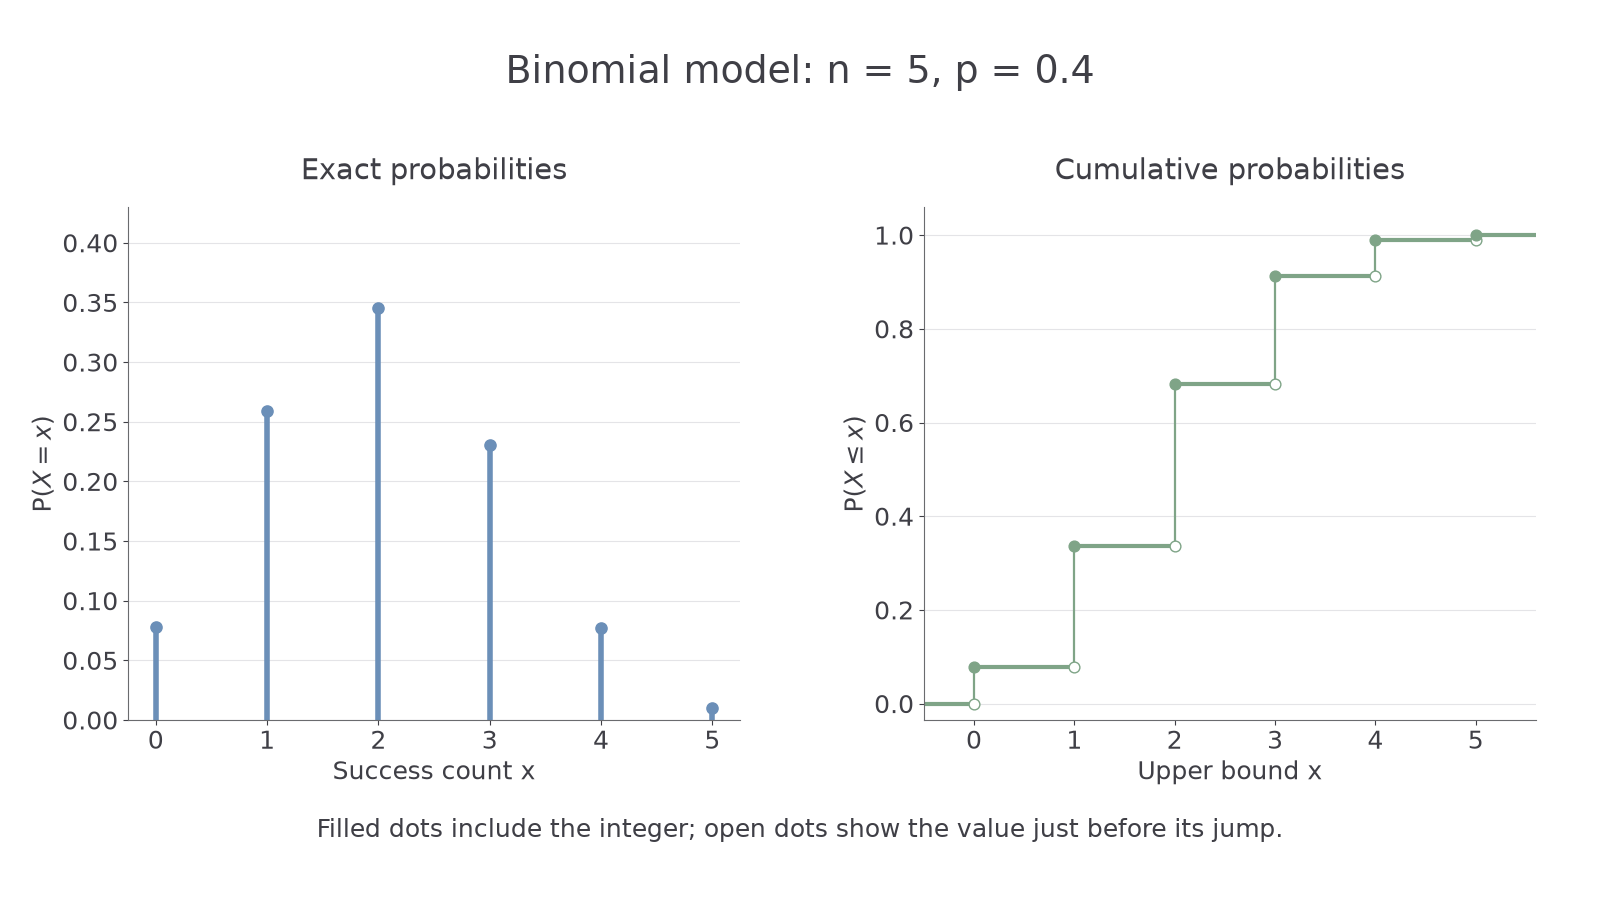
A calculator's exact binomial function needs , although the entry order depends on the device. Distinguish it from cumulative output. The endpoint check is especially useful; . Impossible counts have probability zero. When or , the count is certain, respectively 0 or .
Watch out
Wrong: . This omits nine of the ten lists. Include the combination factor or use a complete exact-count calculator function.
Keep unrounded values for further work. Use a stated accuracy in the answer; the following question explicitly requests three significant figures.
Use the correct integer boundary for a tail
A cumulative function adds whole probability spikes, including the integer used as its endpoint.
Continue this lesson.
You’re previewing NovaLearn without an account. Create a free account to read the rest.
Create free account