Physics 2.6 - 2.7, 2.11 - 2.12 - Speed and its measurement
Calculate average speed and distance, read speed from a distance-time graph, and choose suitable laboratory measurements. Everyday speed estimates help you judge whether an answer is sensible.
Speed, distance and time
Imagine timing a runner from the start line to the finish. The distance travelled is the total length of the route, measured in metres (). The elapsed time is the duration of the journey, measured in seconds (). Average speed tells us how much distance was travelled per second across the whole measured interval.
Average speed
Average speed is the total distance travelled divided by the total time taken. It describes a whole interval, so the object may have moved faster or slower than this value at particular moments.
Average speed
- is average speed in metres per second ()
- is distance travelled in metres ()
- is time taken in seconds ()
The unit follows from the division: . A speed of means that the object covers an average of 5 metres in each second of that interval. It does not mean the speed was exactly at every instant.
Worked example: calculating average speed
A runner travels in .
- The quantities already use metres and seconds, so no conversion is needed.
- Select .
- Substitute: .
- Calculate: .
- Sense-check: at , 150 seconds would give , so the value is consistent.
The same relationship can be rearranged to find distance:
Distance travelled
Worked example: calculating distance
A travelator carries a passenger at an average speed of for .
- Select .
- Substitute: .
- Calculate: .
- Sense-check: just over 1 metre each second for 45 seconds should be just over 45 metres, so 54 metres is plausible.
Do not calculate average speed by simply adding a starting speed and a finishing speed and dividing by two. That shortcut works only in particular kinds of motion. The definition that always applies here is total distance divided by total time.
Distance-time graphs
A distance-time graph records the distance already travelled at each time. Time is on the horizontal axis and distance is on the vertical axis. Before interpreting a line, read both axis quantities and units: the graph is a mathematical record of motion, not a side-view picture of a road or hill.
- A rising straight line means distance increases by an equal amount in each equal time interval: constant speed.
- A steeper line means more distance is covered per second: greater speed.
- A horizontal line means distance is not changing: the object is stationary.
- A curved line means the gradient, and therefore the speed, is changing.
Because distance travelled accumulates, it does not decrease. A downward line would not be a valid distance-travelled graph.
Speed from a distance-time graph
For two points on one straight section:
[DIAGRAM: asset_name: Physics 2.6-2.13 - Speed, acceleration and motion graphs - diagram 01; asset_slug: physics_2_6_2_13_speed_acceleration_and_motion_graphs__diagram_01; recommended_method: matplotlib; description: Exact distance-time graph on a white background with #6A6B6E axes and line, showing points (, ), (, ), (, ) and (, ); label the three straight sections 'constant speed: ', 'stationary' and 'constant speed: '; time horizontal in s, distance vertical in m; no downward segment, decorative marks or colour-dependent meaning.]
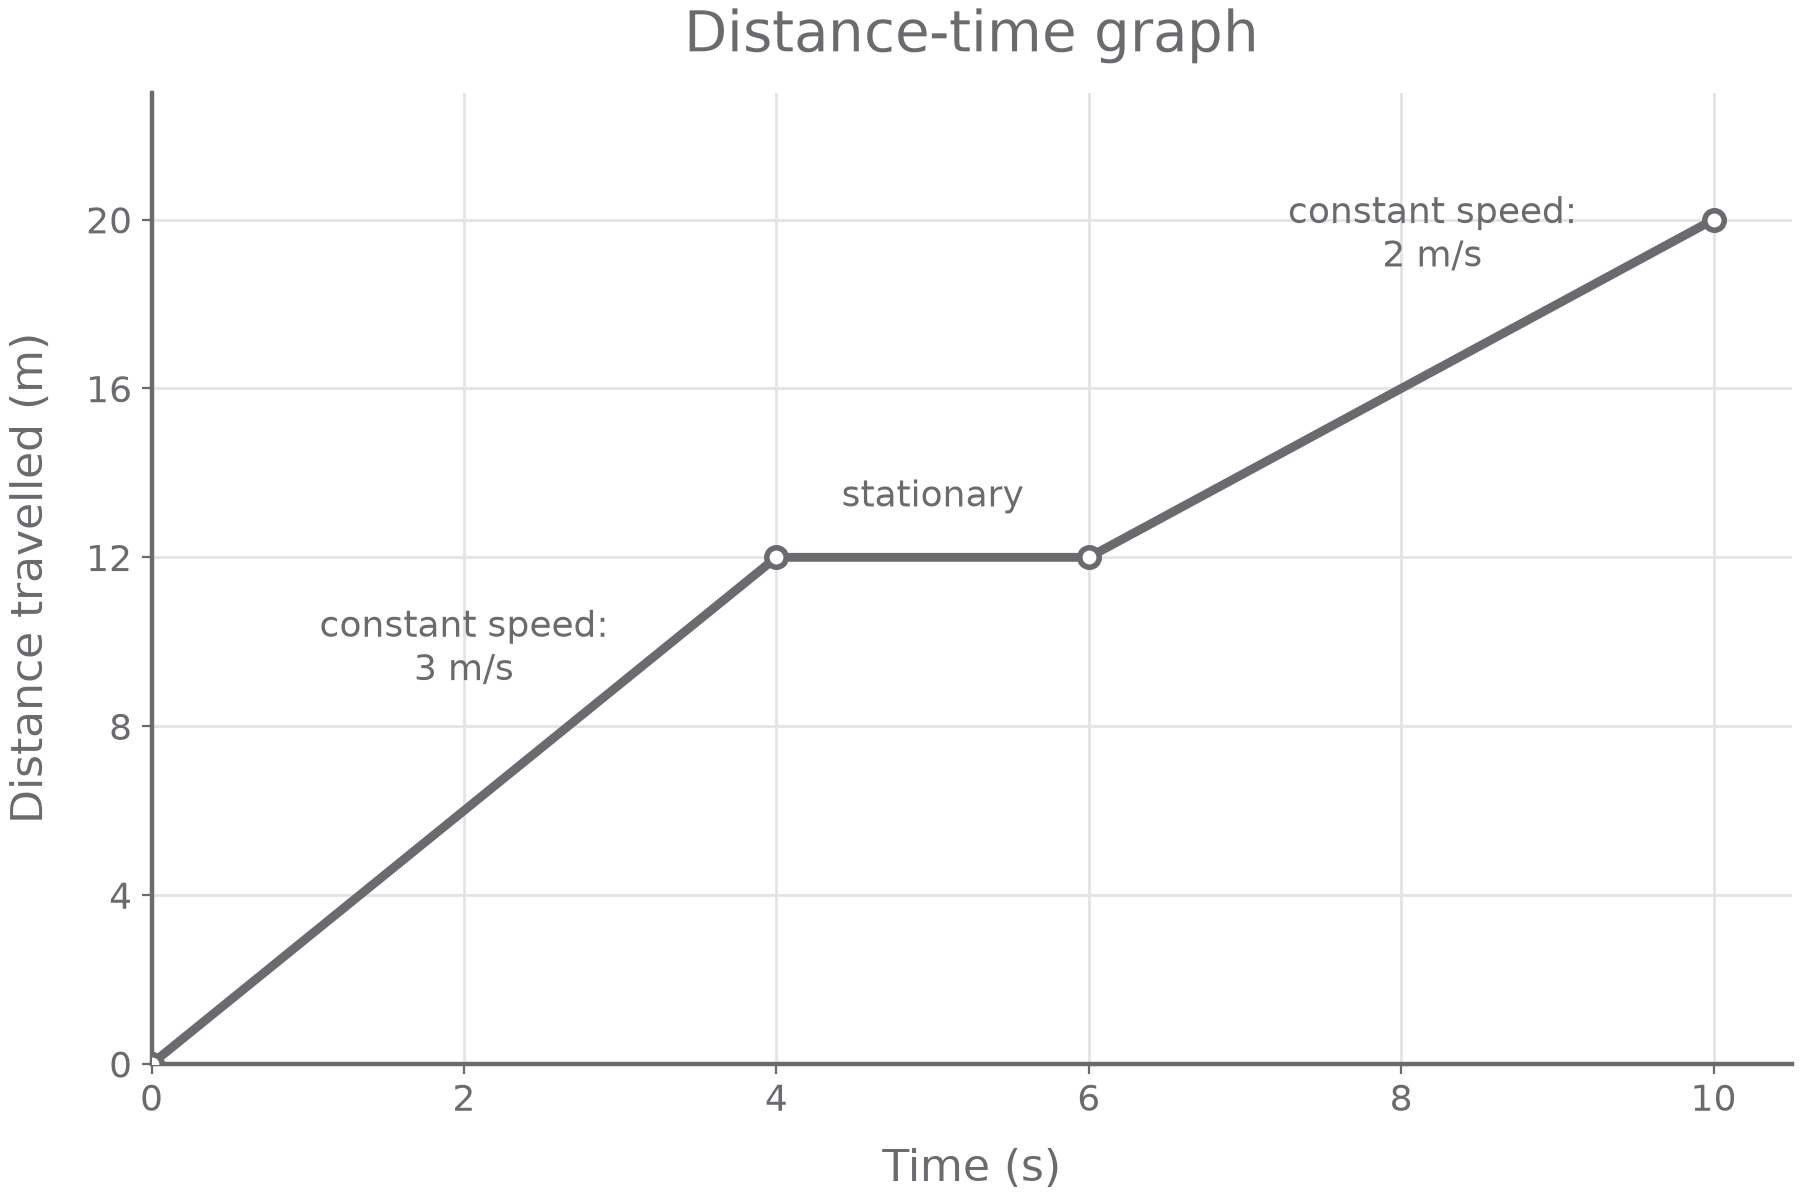
Worked example: reading the journey
For the first section of the graph, choose the endpoints and :
From to , distance remains , so and the speed is .
For the final section, use and :
The first rising section is steeper than the last, matching the numerical comparison . Notice that using would give an average for the whole journey, including the stop; it would not give the speed on the final section.
Continue this lesson.
You’re previewing NovaLearn without an account. Create a free account to read the rest.
Create free account