Biology 9.1 - 9.4 - Communities and interdependence
Explore how organisms form populations, communities and ecosystems, and trace the effects of environmental change, competition, predation, mutualism and parasitism.
Levels of ecological organisation
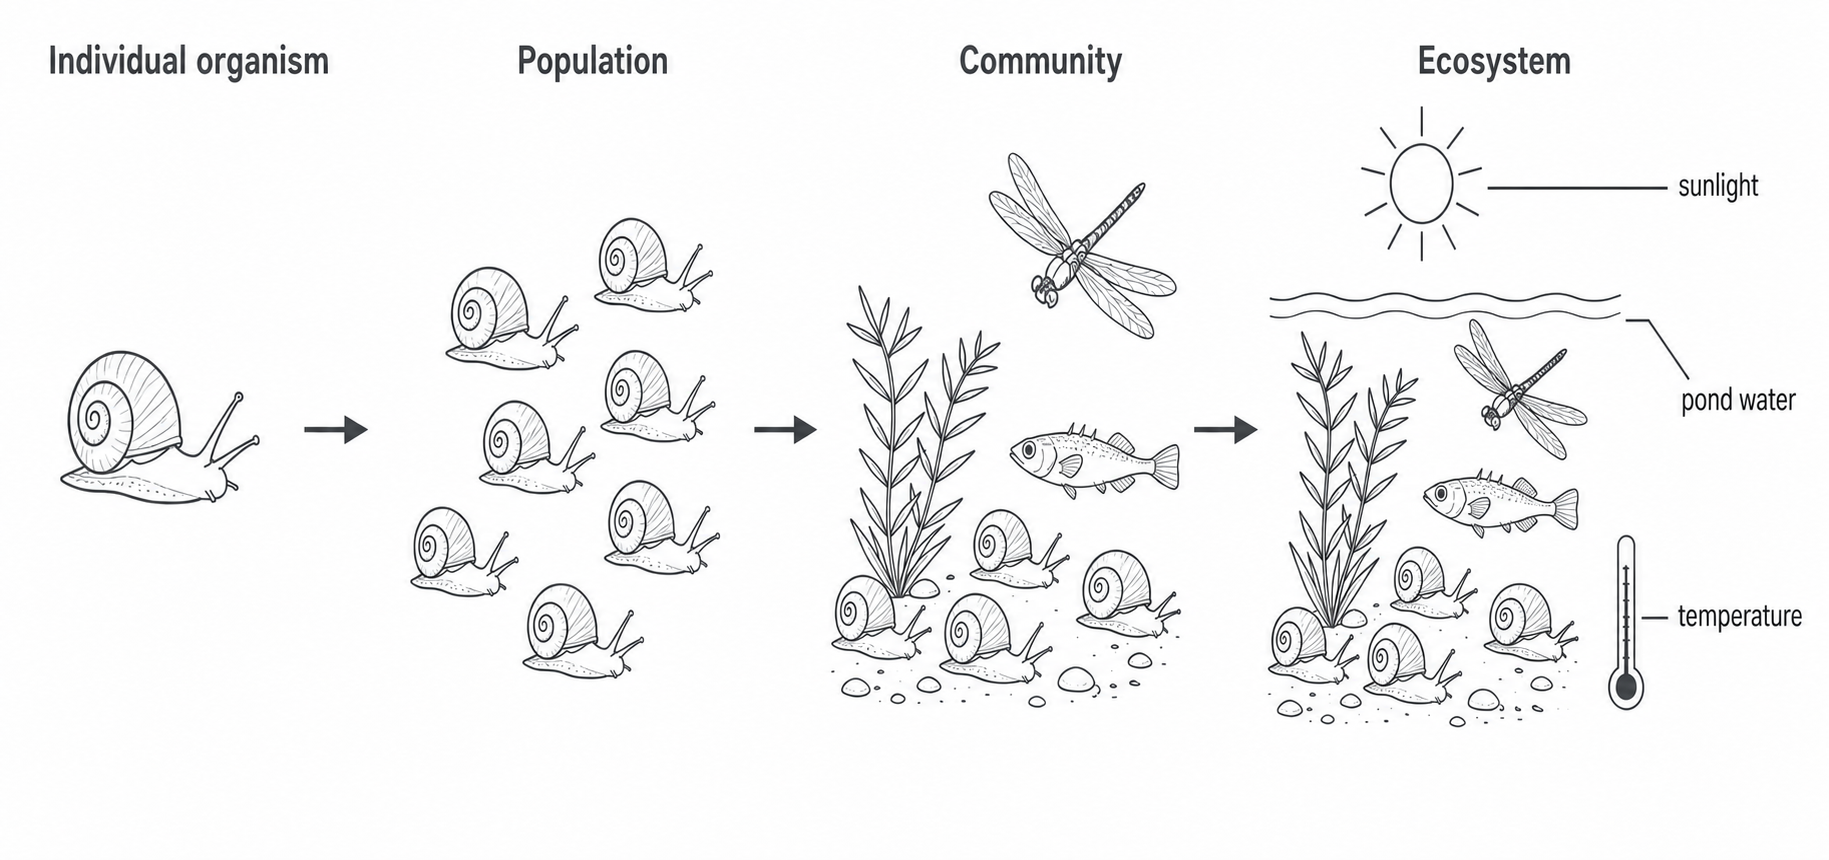
Ecologists can study the same place at different scales. Each scale includes the level before it, but adds more organisms or more of the environment.
| Level | Meaning | Pond example |
|---|---|---|
| Individual organism | One living individual. | One pond snail. |
| Population | All the organisms of the same species living in the same area at the same time. | Every pond snail of one species in one pond. Snails of several species are not one population. |
| Community | All the populations of different species living and interacting in the same area at the same time. | Populations of pond snails, pondweed, sticklebacks, dragonflies and microorganisms. |
| Ecosystem | The community of organisms, the non-living environment, and the interactions between them. | The pond community together with abiotic conditions such as water, light and temperature. |
The sequence is:
individual organism → population → community → ecosystem
An ecosystem is not just "everything alive" in a place; that describes the community. It is also not just the place itself. The defining idea is the living community interacting with the abiotic environment.
[DIAGRAM: asset_name: Biology 9.1-9.4 - Ecosystems, communities and factors - diagram 01; asset_slug: biology_9_1_9_4_ecosystems_communities_and_factors__diagram_01; recommended_method: image_gen; description: A clean monochrome four-stage pond infographic on white, read left to right with visible right-pointing arrows: Individual organism shows one pond snail; Population shows several pond snails of the same species; Community shows pond snails plus pondweed, stickleback fish and a dragonfly; Ecosystem shows that same living community together with directly labelled sunlight, pond water and temperature. Exact stage labels must be Individual organism, Population, Community and Ecosystem. Use #6A6B6E linework and labels; no colour coding, food-chain arrows, trophic levels, sampling equipment, biomass, cycles or decorative frame.]
Abiotic factors and communities
An abiotic factor is a non-living physical or chemical part of the environment. A change in an abiotic factor can alter survival, growth or reproduction. That changes the abundance of one or more populations and therefore changes the composition of the community.
| Abiotic factor | Direct biological effect | Possible community consequence |
|---|---|---|
| Temperature | Enzyme-controlled reactions and other life processes work best within a suitable temperature range for each species. Temperatures outside that range can reduce growth or survival. | Species have different tolerances, so some populations may fall while others form a larger proportion of the community. |
| Light | Light is needed for photosynthesis by plants and algae. Less light can reduce their growth. | Populations that use plants for food or shelter may then also change. Shade-tolerant species may be affected differently. |
| Water | Water is needed for cell reactions, photosynthesis and keeping plant cells turgid. It is also the habitat of aquatic organisms. | Drought can reduce plant growth and survival, removing food or shelter used by other populations. |
| Pollutants | Harmful concentrations can poison or damage organisms, or reduce growth and reproduction. | Sensitive species may decline while more tolerant species make up a larger fraction of the community; dependent populations can then also change. |
These are not four automatic rules. For example, a temperature rise does not make every population fall: each species has a different suitable range. Likewise, pollution may change the relative abundance of species rather than remove all life.
Worked example: interpreting abiotic-factor data
The following original dataset shows pondweed abundance at four light intensities.
| Light intensity (arbitrary units) | Mean pondweed shoots per |
|---|---|
| 20 | 6 |
| 40 | 11 |
| 60 | 18 |
| 80 | 19 |
- Identify the quantities. Light intensity is the abiotic factor. Mean pondweed shoots per is the measured population abundance.
- Describe the overall pattern with data. As light intensity rises from 20 to 80 arbitrary units, mean abundance rises from 6 to 19 shoots per .
- Notice the shape, not just the direction. From 40 to 60 units, the increase is shoots per . From 60 to 80 units, it is only shoot per . The response is levelling off at the highest values shown.
- Explain with biology. More light can support a higher rate of photosynthesis, so more new plant material can be made and more shoots can grow. At high light, a different factor may be limiting further growth.
- Limit the conclusion. The data show an association between light and abundance. Unless other factors were controlled, they do not prove that light alone caused the difference.
Continue this lesson.
You’re previewing NovaLearn without an account. Create a free account to read the rest.
Create free account