Chemistry 7.15-7.16 - Activation energy and profiles
Explain why a reaction can need an initial energy input, then draw and interpret exothermic and endothermic reaction profiles. Distinguish the activation-energy barrier from the overall energy change.
Activation energy: the threshold for reaction
Some reactions do not begin as soon as the reactants meet. A fuel and oxygen can be together without reacting noticeably until a flame or spark transfers energy to some of their particles. The initial input and the energy later transferred by the reaction are not the same thing.
At particle level, reactant particles must collide. A collision only leads to reaction if the particles have enough energy for the reactant arrangement to begin changing; in many reactions this includes bonds beginning to break as atoms rearrange into products. Collisions below this threshold do not form products in that collision.
Activation energy
The minimum energy that reacting particles must have for a reaction to occur.
Activation energy is a threshold, not a quantity of energy stored inside every particle. A particle collision can have less than, equal to or more than the threshold energy. Equal to or more than the activation energy can allow reaction; less than it cannot.
The threshold is also different from the overall energy transfer:
- activation energy concerns the minimum energy needed to get from reactants towards reaction;
- exothermic or endothermic concerns the overall transfer of energy between the reacting system and the surroundings.
An exothermic reaction can therefore have an activation-energy barrier. The reaction may need an initial spark even though, once underway, it transfers energy to the surroundings.
The anatomy of a reaction profile
A reaction profile is a model of how the energy of a reacting system changes along the route from reactants to products. It connects particle behaviour to a symbolic graph.
Read the graph in this order:
- The vertical axis is Energy. It is not temperature, amount of substance or reaction rate.
- The horizontal axis is Progress of reaction. It is not time, so the curve is not a measurement taken every few seconds.
- The left horizontal level is labelled Reactants and the right horizontal level is labelled Products.
- The curve rises from the reactant level to a peak and then falls to the product level. The peak is the top of the energy barrier on this simple model.
- Activation energy is shown by the vertical energy difference from the reactant level to the peak.
[DIAGRAM: asset_name: Chemistry 7.15-7.16 - Activation energy and reaction profiles - diagram 01; asset_slug: chemistry_7_15_7_16_activation_energy_and_reaction_profiles__diagram_01; recommended_method: matplotlib; description: Two side-by-side qualitative reaction profiles on white: exothermic with products below reactants and endothermic with products above reactants. Each has #6A6B6E Energy and Progress of reaction axes, labelled Reactants and Products levels, one smooth curve whose peak is above both levels, and an Activation energy vertical span from the reactant level to the peak. Exclude numerical scales, temperature or time axes, catalyst pathways, overall-energy arrows and advanced mechanism labels.]
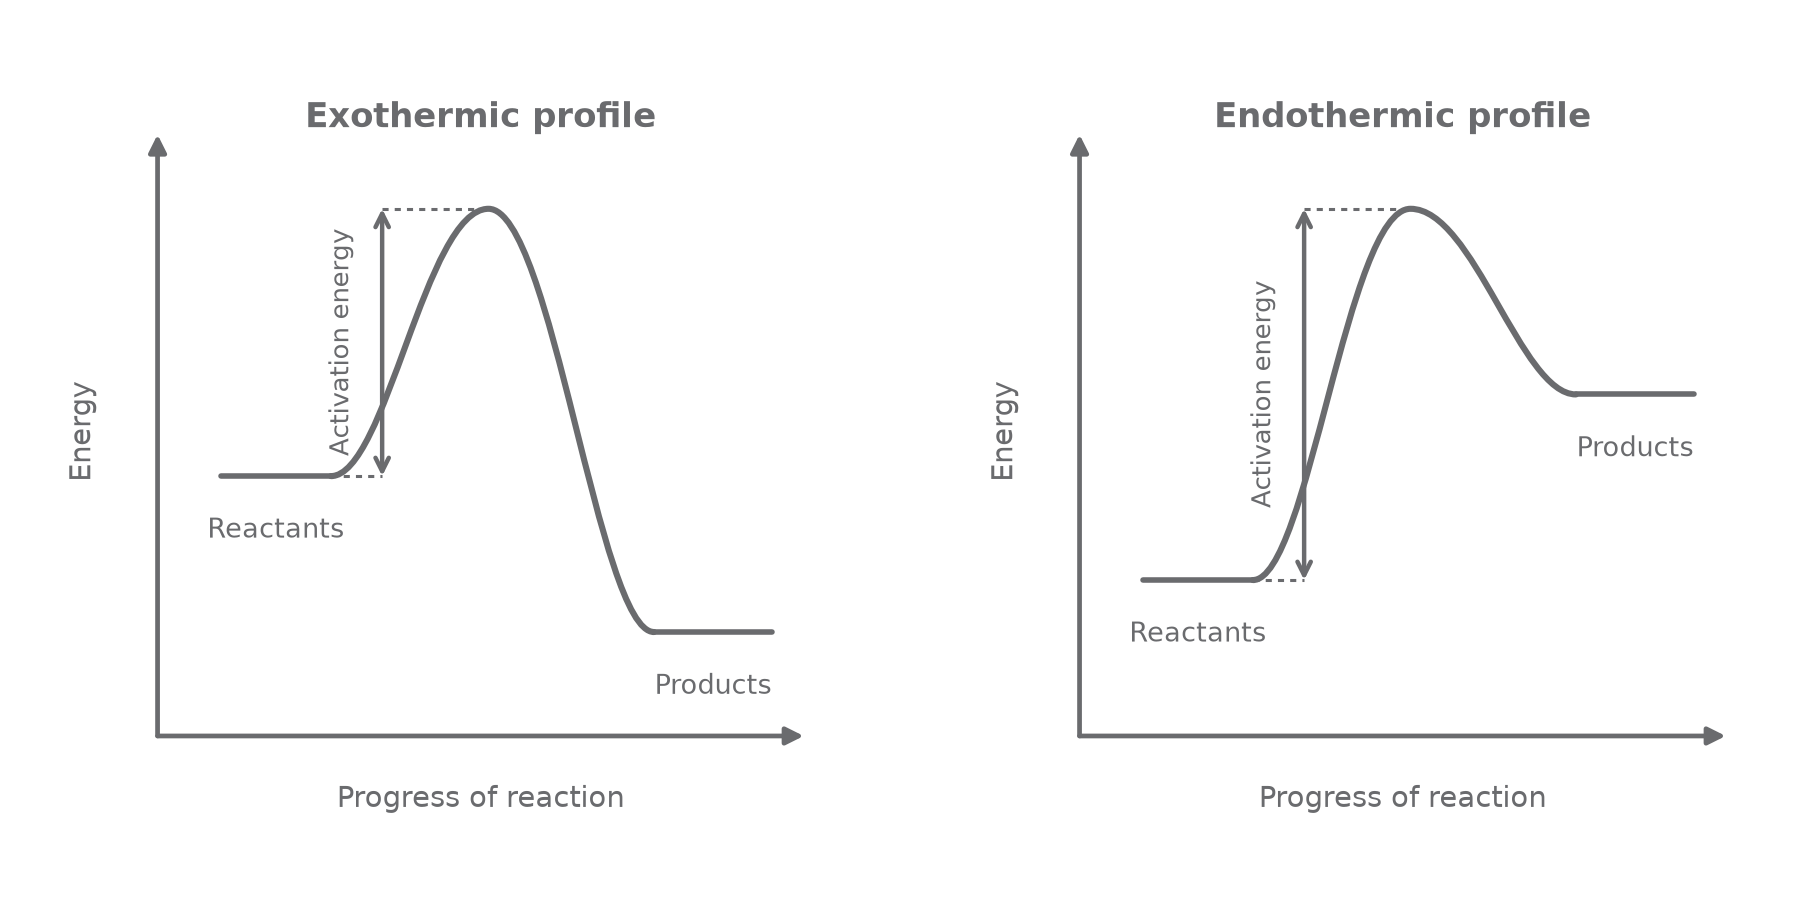
The activation-energy marker must not start at the horizontal axis. Its lower end is level with the reactants because activation energy is the extra energy needed above the reactants' starting energy. It must not run from the products to the peak either; that would describe the barrier for the reverse direction, which is not the requested forward activation energy here.
Worked example: reading a partly labelled profile
Suppose a profile already has a left-hand reactant line, a curve with one peak and a right-hand product line.
- Read the axes first. If the horizontal axis says Time, replace it with Progress of reaction.
- Find the reactant energy level on the left; this fixes the lower end of the activation-energy span.
- Find the maximum of the curve; this fixes the upper end of the span.
- Draw a vertical marker between those two energy levels and label it Activation energy.
This method works whether the products finish above or below the reactants. Product position decides whether the reaction is endothermic or exothermic; it does not change where the forward activation-energy span begins.
Continue this lesson.
You’re previewing NovaLearn without an account. Create a free account to read the rest.
Create free account