2.01a–2.01d - Samples, random sampling and bias
Choose a sample that can tell you something useful about a population. You will select simple random samples, recognise other sampling methods and explain why a bigger survey can still give a worse answer.
Populations, samples and uncertain conclusions
Could surveying 400 students in the library at 8 pm tell you less about a college than surveying 60 students chosen from its enrolment list? Before counting responses, ask who can get into each survey. The library survey misses everyone elsewhere, however carefully its answers are recorded.
You already know
A proportion is a count divided by the relevant total. A mean is the sum of the observations divided by their number. Changing which observations you collect can change either summary.
Start by stating exactly whose behaviour you want to understand. “All residents” and “all employed residents who travel to work” are different groups; a travel survey must say which one it means.
Population, sample and sampling unit
The population is the complete collection of individuals or items of interest in an investigation. A sample is a collection selected from that population. A sampling unit is one individual or item selected. For a study of all 1,200 employees at a hospital, one employee is a unit; the 60 employees surveyed are the sample. The population is not just the people who reply.
A sampling frame is the list or other source from which units are selected. A complete employee list could be a frame; a list containing only daytime staff misses night staff. Random selection from an incomplete list does not recover the missing people.
A census attempts to obtain information from every member of the defined population. It avoids selecting only a sample, but may be slow or expensive and can still suffer missing or inaccurate responses. Testing every manufactured item to destruction would leave nothing to sell, so sampling is essential there.
OCR's large data set comes from the 2001 and 2011 England and Wales censuses. Its four tables use 348 aligned Local Authority areas. A row is an area, not one person. Studying all those rows describes those areas for those census dates; selecting some rows creates a sample of areas. Neither operation is a fresh survey of present-day commuters. For travel-to-work data, the relevant category is people in employment; the recorded method covers the longest part of the usual journey by distance.
To make an informal inference, use a sample result as an estimate of a population feature, then acknowledge what the sample cannot settle.
Sample proportion
If a sample has observed units and have the characteristic of interest, its proportion with that characteristic is
Multiply by to express it as a percentage. Use the total for the group actually being investigated.
Not in the formula sheet: learn it.
The calculation is exact for the observed sample. Its use as a population estimate is where uncertainty enters.
Worked example 1: estimate without claiming certainty
Question. A simple random sample of 80 employees who travel to work contains 28 cyclists. Give an informal estimate of the proportion of all commuting employees who cycle, and state a limitation.
Plan. Calculate the sample proportion, then distinguish the observed sample from the population.
Why this denominator? Everyone in this sample belongs to the target group of commuting employees.
Answer. The sample suggests that about of commuting employees cycle. It does not establish that the population proportion is exactly : another random sample could contain a different mix of commuters.
Check. of is , so the percentage agrees with the sample count.
Now change just the number of cyclists observed, keeping the sample size and selection method fixed. This reveals sampling variation: different samples from the same population can give different estimates.
Worked example 2: a different sample result
Question. A second simple random sample of 80 commuting employees contains 36 cyclists. Give its estimate and explain whether this proves that cycling has become more common.
Plan. Repeat the proportion calculation and compare the conclusions the two samples support.
Why avoid a claim of change? The difference could come from selecting different employees, even if the population has not changed at all.
Answer. This sample suggests about . The estimates differ by percentage points, but the samples alone do not prove a population change.
Check. , and , consistent with the percentage-point difference.
A sample mean likewise estimates a population mean rather than revealing it exactly. Larger well-selected samples generally have less sampling variation, but size cannot rescue a systematically unrepresentative selection.
Watch out
Wrong: “The sample gives , so exactly of the population cycle.” Correct: the sample gives an estimate, with uncertainty from sampling variation and possible defects in how responses were obtained.
Try the inference with another count, keeping the target population explicit.
Selecting a simple random sample
Random sampling needs a reproducible rule, not an interviewer choosing people who seem typical.
Simple random sample
In a simple random sample, every possible sample of the required size has the same probability of being selected. Uniformly selecting distinct labels from a complete list is an example without replacement. Selecting one intact class at random is generally not a simple random sample of individual students.
Here is a surprising trap. Put four people into two pairs, and , and choose one pair by a fair coin. Every person has a one-half chance of selection, yet only two of the six possible pairs can be chosen. Equal chances for individuals are not enough.
[DIAGRAM: asset_name: Equal individual chances do not make every pair possible; asset_slug: h240_sampling_pairs; caption: Choosing AB or CD fairly gives each person a one-half chance, but excludes four possible pairs; description: The six pairs AB, AC, AD, BC, BD and CD are shown. AB and CD are highlighted as the only selectable pairs when a fair coin chooses one intact pair. The other four pairs are labelled impossible under this rule. A bottom statement distinguishes equal individual inclusion chances from equal chances for every two-person sample.]
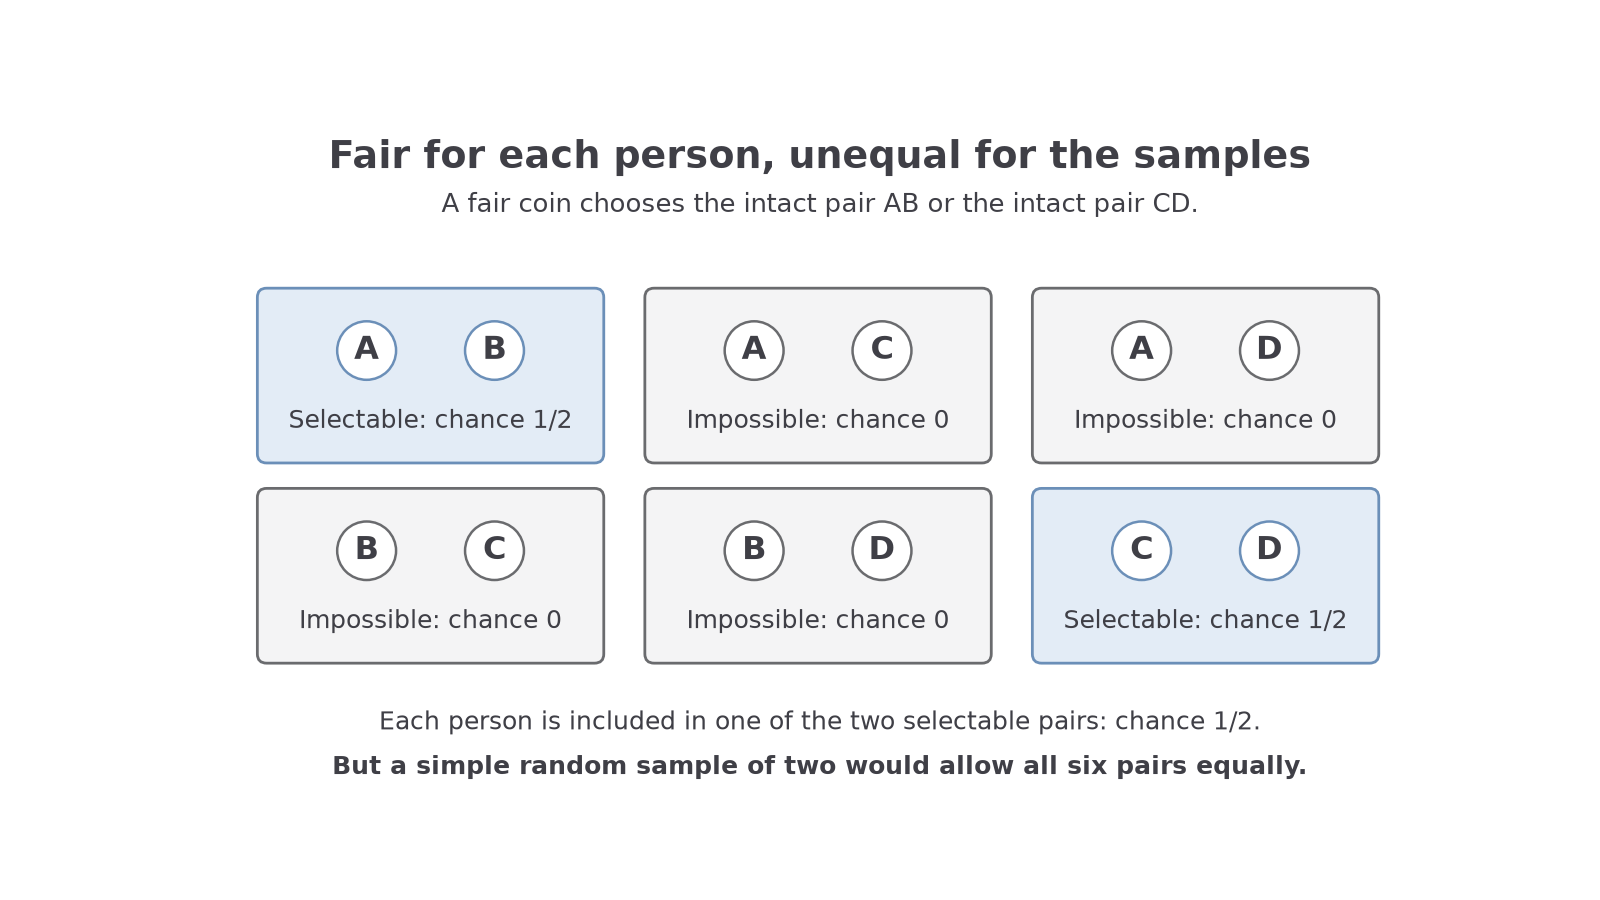
For a survey of people, sample without replacement: once a person is selected, do not select that person again. Unless told otherwise, assume the population is large enough to use this procedure. With a complete list of 240 people, label them 001 to 240 and use a uniform random-number generator until 12 distinct valid labels have been selected. Reject out-of-range outputs and repeats. Software that directly selects 12 distinct labels uniformly is equally suitable.
The rejection rule is part of the method. Keep reading the random sequence after a rejection; do not substitute the next person on the list or choose a convenient friend.
Worked example 3: follow a random sequence
Question. Employees are labelled 01–50. Select four without replacement from the random outputs 07, 52, 07, 31, 00, 18, 49, 12, 26, 09. Explain the rejections before the fourth selection.
Plan. Read from left to right, retaining each new label in the frame until four have been accepted.
| Output | Decision | Reason |
|---|---|---|
| 07 | Select | First valid label |
| 52 | Reject | Outside 01–50 |
| 07 | Reject | Already selected |
| 31 | Select | New valid label |
| 00 | Reject | Outside 01–50 |
| 18 | Select | New valid label |
| 49 | Select and stop | Fourth distinct valid label |
Why reject a repeated label? Sampling without replacement must produce four different employees, not four readings from fewer people.
Answer. Select employees 07, 31, 18 and 49.
Check. There are four distinct labels, all in 01–50, in the supplied order.
Change only the frame: the list now ends at 30. The random outputs stay the same, so some previously valid labels must be rejected.
Worked example 4: change the valid range
Question. Employees are now labelled 01–30. Use the same outputs 07, 52, 07, 31, 00, 18, 49, 12, 26, 09 to select four without replacement.
Plan. Apply the same rule with the new upper limit, continuing until four labels survive.
| Selected label | Why earlier outputs were rejected |
|---|---|
| 07 | First valid output |
| 18 | 52, 31 and 00 are out of range; the second 07 repeats |
| 12 | 49 is out of range |
| 26 | New valid label; stop at four |
Why continue past 49? It is no longer in the frame, so it cannot fill the fourth place.
Answer. Select employees 07, 18, 12 and 26.
Check. All four retained labels lie between 01 and 30; none occurs twice.
A randomly selected person may decline to respond. If non-responders differ systematically from responders, the collected answers can suffer non-response bias. Use planned follow-up contacts and, if replacements are needed, a preplanned random selection procedure. Random selection cannot guarantee that every realised sample mirrors the population perfectly.
Exam tip
Describe the frame, unique labels, uniform random selection, handling of invalid outputs and duplicates, and when to stop. “Choose any four” does not specify a random method.
Use the same selection rule with a different frame and sequence.
Recognising methods and their tradeoffs
Different selection rules trade ease of collection against coverage of the population. Read what the investigator actually does before naming the method.
Continue this lesson.
You’re previewing NovaLearn without an account. Create a free account to read the rest.
Create free account