1.02z - Building, comparing and refining function models
Turn a practical decision into a function, then test what its predictions mean. In 1.02z you will choose variables, assumptions and a useful domain, compare models with fresh evidence, and make specific refinements when a model stops describing the situation.
Choosing variables assumptions and a domain
A tank contains litres now and litres after minutes. Can those two measurements tell you how much water it contains at every other time? A straight line gives a quick prediction, but choosing a straight line already makes an assumption about the filling.
You already know
A linear function has a constant gradient: equal input increases give equal output increases. A function's domain states its permitted inputs; a practical model may need a narrower domain than its algebraic formula.
First specify the purpose: predict volume during filling, rather than water temperature or filling cost. Let be time in minutes after filling starts, and be volume in litres. The initial volume is known; what remains to model is how it changes.
Function model
A function model is a simplified mathematical description that assigns an output to each permitted input to answer a practical question. Its variables, assumptions and useful domain belong to the model. For example, a constant-rate volume model treats time as continuous. A fractional number of parcels is not a valid input to a model of a parcel count.
An assumption simplifies the situation. Here, constant net inflow means inflow minus outflow remains constant; it does not require there to be no outflow at all.
Constant-rate model
If an output starts at and changes at constant rate ,
Use units consistent with and restrict the domain to where the constant-rate assumption and physical constraints apply.
Not in the formula sheet: learn it.
The formula is a structure, not evidence that a rate is constant. Fit its parameters from the measurements, then ask whether the structure is sensible.
Worked example 1: constructing a filling model
Question. A -litre tank contains litres at and reaches capacity at minutes. Construct a linear model during these eight minutes, interpret its gradient and predict the volume at .
Plan. Use the initial volume as intercept and the change per minute as gradient.
Why this step? A linear model assumes constant net inflow; the gradient is its physical rate, not just a number attached to .
Answer. , for , with a constant net inflow of . It predicts litres at minutes.
Check. and . These checks confirm the fit, not the assumption of constant flow between the measurements.
Change only the observed filling time: the same tank now takes minutes to reach capacity. The initial volume and capacity stay fixed.
Worked example 2: changing one observation
Question. With litres initially and litres at minutes, construct the corresponding linear model and predict the volume at minutes.
Plan. Recalculate the rate using the longer time interval.
Why this step? The measured average rate has changed; retaining the old coefficient would no longer fit both observations.
Answer. for , assuming constant net inflow of . Its prediction is litres.
Check. , while the earlier model would give , contradicting the new measurement.
Interpolation uses an input within the measured span; extrapolation goes beyond it. The first formula gives , exceeding the capacity. Its algebraic domain is , but its useful domain here is only .
Counted objects need a discrete domain. A delivery costing £ plus £ per parcel has for integers . Average cost is , for integers ; averaging the cost over zero parcels is undefined.
Watch out
Wrong: “The formula accepts , so its prediction is valid.” Right: check the useful domain and capacity. A permissible algebraic substitution can still give an unsupported practical prediction.
Now construct a line from different measurements and say what its coefficient means physically.
Comparing predictions with fresh data
A model should earn your trust on data it was not chosen to fit.
Return to the tank that reaches capacity after minutes. Additional measurements show progressively smaller gains:
| , minutes | |||||
|---|---|---|---|---|---|
| Volume, litres | |||||
Try . Fitting the observations at gives
Thus . It also predicts and at the other tabulated times.
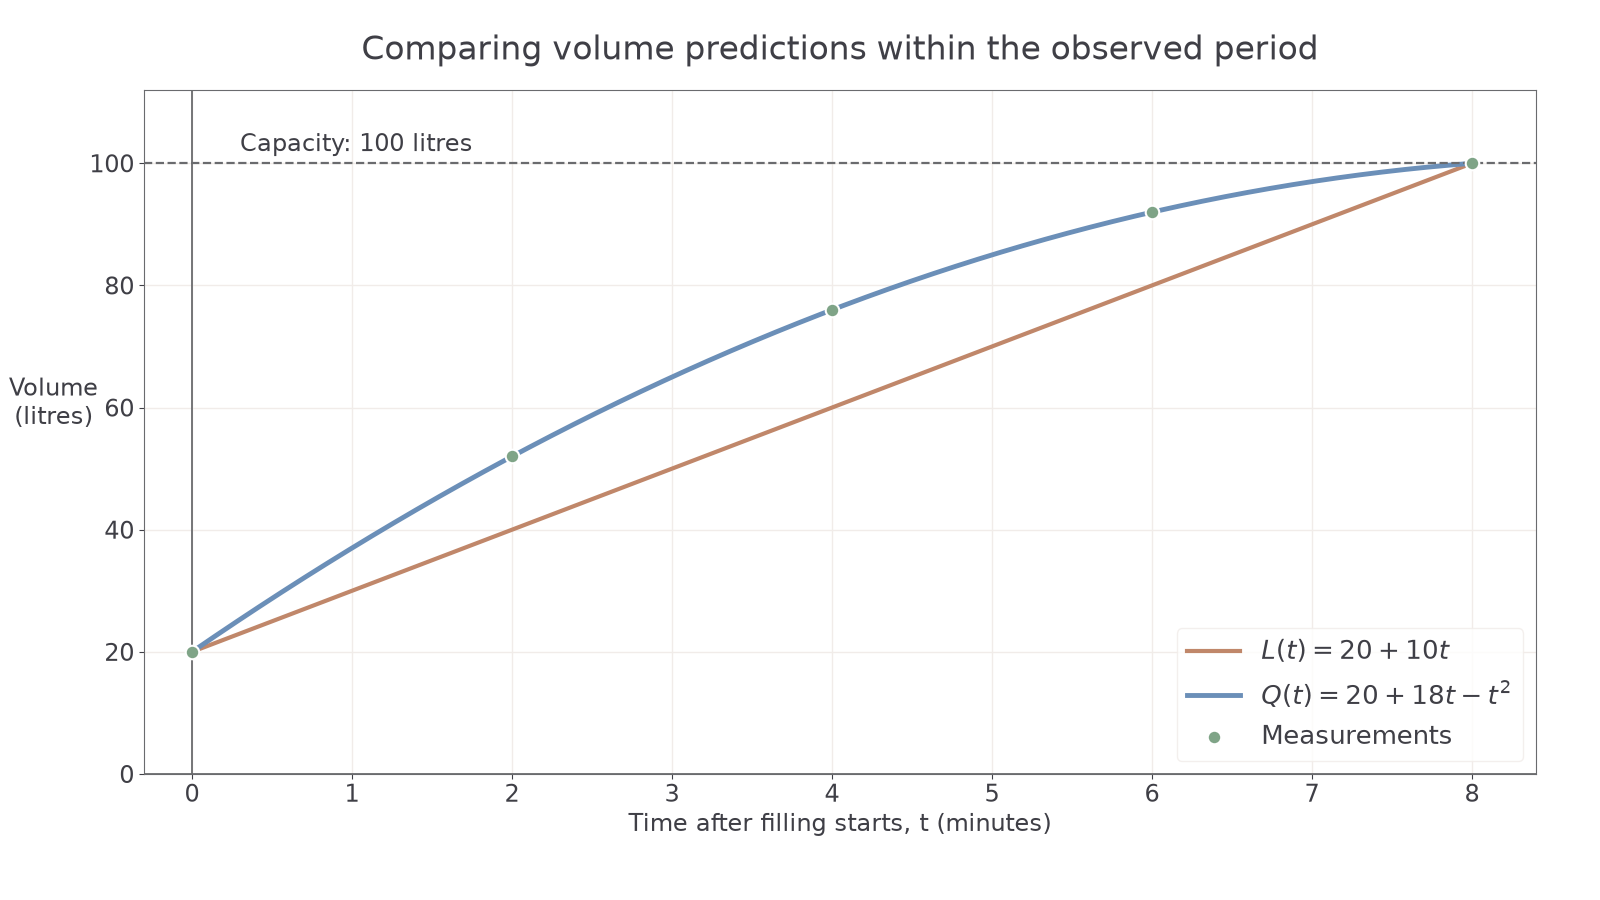
There are infinitely many curves through the same two endpoints. In fact, gives at and at , for every real , yet gives at . The midpoint prediction can be any real number before physical restrictions are imposed. Two endpoint checks alone tell you remarkably little about the curve between them.
Residual
A residual is observed output minus predicted output. For example, an observation of against a prediction of has residual : the model overpredicts by . A small signed total of residuals is not necessarily a good fit because positive and negative errors may cancel.
To compare numerical errors, choose a stated criterion. Squared residuals treat errors in opposite directions symmetrically and give larger errors more weight.
Sum of squared residuals
For observations and corresponding predictions ,
Compare models on the same observations and units. A smaller value means a closer fit by this criterion, not proof that the assumptions are true.
Not in the formula sheet: learn it.
Keep fresh observations separate from those used to fit either model. They test prediction rather than the ability to pass through chosen points.
Worked example 3: testing the models on fresh measurements
Question. Fresh measurements are litres at and litres at . Compare and using squared residuals.
Plan. Evaluate both models at the two fresh times and square observed-minus-predicted differences.
Why this step? Testing on fresh data avoids claiming success merely because the parameters were chosen to reproduce the observations.
Answer. fits these fresh observations much better by this criterion, since . This supports using it within the observed filling period; it does not justify unlimited extrapolation.
Check. The linear residuals are both large and positive. The quadratic residuals agree with the much smaller squared total.
Change just the last fresh measurement from to litres. This tests how the conclusion responds to a small change in the evidence.
Worked example 4: sensitivity to a changed measurement
Question. Repeat the comparison with fresh observations litres at and litres at .
Plan. Retain the model predictions and update only the changed residual.
Why this step? A residual of and a residual of have the same square; changing an error's direction need not change its contribution to this criterion.
Answer. The quadratic is still preferred on these data: . This conclusion is stable under this particular measurement change, but further evidence could change it.
Check. The quadratic's second residual has changed from to ; both square to .
A spreadsheet output can show times, observations, predictions and residuals in separate columns, with a scatter plot using numerical time horizontally. Interpret the output rather than trusting the appearance: at , an observed value , prediction and displayed residual are consistent. A displayed residual signals the opposite subtraction convention, not a different prediction; its square remains . Recomputing after a parameter change should update every prediction and residual. Rounded columns, a coarse time grid or a narrow axis scale can hide discrepancies. This is a way to investigate models, not evidence that their assumptions hold.
Watch out
Wrong: add the residuals and and conclude there is no error. Right: their sum of squares is . Cancellation hides errors; it does not remove them.
The next comparison supplies predictions directly, so focus on the criterion and the conclusion it supports.
Responding to limits and changing assumptions
A close fit during filling does not tell you what happens after the tank is full.
For , completing the square gives . It predicts litres at minutes and then a falling volume. That is impossible for a -litre tank whose filling stops at capacity and which has no later outflow.
Assumption, limitation and refinement
An assumption is a simplification used to build a model, such as constant net inflow. A limitation is a restriction on how reliably it describes the situation, such as missing observed slowing. A refinement changes a stated assumption, functional form or useful domain to address a particular limitation. “Make it more accurate” alone is not a refinement.
A capacity rule gives a concrete improvement. The formula must change when the process changes; fitting an ever more complicated curve to earlier data cannot supply missing information about later behaviour.
Worked example 5: stopping at capacity
Question. The tank follows until it first reaches litres. Filling then stops, and no water enters or leaves. Refine the model for and predict the volume at .
Plan. Find the first capacity time and use a constant piece afterwards.
Why this step? The later algebraic root belongs to an extension of the old quadratic after the process has already changed; it is not a second filling time.
Answer.
It predicts litres, rather than the unrefined .
Check. At , both pieces give . The refinement respects capacity and the stated absence of later flows.
Change only the post-filling assumption. A leak now removes litres per minute after filling stops, continuing at that rate until the tank is empty.
Worked example 6: refining the later process
Question. Keep the same filling model, but add the stated leak after . Refine the model for and predict the volume at .
Plan. Measure leakage time from , then stop the loss when volume reaches zero.
Why this step? The leak has run for minutes, not minutes. Using would start the loss too early.
Answer.
It predicts litres at minutes, under the constant-leak assumption.
Check. At the first two rules agree at ; at the last two agree at . No predicted volume is negative.
These piecewise rules are constructed from the assumptions; they are not supplied formulas to memorise. The leaking refinement happens to agree with at , but one matching prediction does not validate the quadratic's later behaviour. Measure after filling to test the leak rate. If loss slows as the tank empties, replace the constant-rate assumption too.
Prefer a simple model adequate for the decision. More parameters can fit measurement noise, and a good fit cannot rescue a physically impossible prediction.
Watch out
Wrong: “Use the quadratic for all time because its fresh residuals are small.” Right: check capacity, non-negative volume and the process after filling. The useful domain and the assumptions limit what the fit supports.
An explanation should identify how the model's prediction conflicts with the situation. Here directly conflicts with a capacity of litres; merely calling the model “unrealistic” leaves that reason unstated.
Exam tip
For an OCR limitation question, connect a model feature to the context: name the change in rate or physical constraint that the model fails to represent. A large-looking answer alone does not explain a limitation.
Apply the capacity idea to a different linear filling model, without adding an unsupported later process.
Turning a decision into a checked model
A practical question often hides the choice of what to model. For a fundraising trip, income alone will not answer whether the trip meets its target: you need income minus costs.
Specify and analyse the decision first. Then collect relevant information, process and represent it mathematically, and interpret the result in context. If a check reveals missing information or a failed assumption, repeat the cycle. These stages do work: they decide what data to collect, what equations to build and whether an answer can actually be used.
Surplus model
If income is and cost is ,
State the permitted values of , including whole-number and capacity restrictions. A target surplus requires .
Not in the formula sheet: learn it.
The following decision requires a supplier's price, a ticket price and capacity. Booking demand would be another essential measurement before committing money, even if the algebra says the target is achievable.
Worked example 7: a minimum booking threshold
Question. A charity wants a trip to raise at least £. A coach costs £ plus £ per passenger. Tickets cost £, and there are seats. Determine the minimum number of paid passengers, stating assumptions.
Plan. Construct surplus, solve the target inequality, then test the neighbouring integer bookings and capacity.
Assume every passenger pays, the quoted costs are complete, and there are no refunds or free seats. Let be the number of paid passengers, an integer with .
Why this step? A minimum booking count must be rounded upwards to an allowed integer; is a threshold, not a possible attendance.
Answer. At least paid passengers are required. This is within the -seat capacity, under the stated cost and payment assumptions.
Check. , while . These checks establish the minimum, but do not establish that people will book.
Repeat the cycle when information changes. Alter only the fixed cost: the supplier now discloses an additional £ booking fee.
Worked example 8: new information changes the decision
Question. With all other conditions unchanged, determine the revised minimum bookings after the £ fee is included.
Plan. Revise the fixed cost, then solve and check the same decision again.
Why this step? The omitted fee changes the fixed cost, not the income per passenger; correcting the responsible assumption avoids changing unrelated parts of the model.
Answer. The revised minimum is paid passengers, still within capacity.
Check. and . Ask for the supplier's complete quote and check likely paid demand before using this booking threshold.
A failed feasibility check is useful information. It sends you back to revise a price, capacity or cost assumption, then calculate again; it is not a reason to round an inconvenient answer down. This completes a second cycle: new information, revised representation, new result and a fresh contextual check.
The tank question follows the same logic. Two measurements give a line only after a constant-rate assumption. Intermediate observations support a curved model, and capacity changes what happens next. More arithmetic cannot replace the missing observations or assumptions.
Watch out
Wrong: “The minimum is , but there are only places, so use .” Right: the target is infeasible under those conditions. Specify and check a change before claiming the target can be reached.
Make a decision where capacity blocks the target, then propose a numerically workable refinement.
Quick Recap
- Define the decision, variables, units, assumptions and useful domain before relying on a formula.
- Test predictions on fresh observations; a small error on fitted points is weak evidence.
- Compare models using a stated criterion, then check physical constraints and practical meaning.
- Refine the assumption or rule responsible for a failure, and repeat the problem-solving cycle.
Two tank measurements do not determine every intermediate or later volume: a line requires constant net inflow, fresh data test that assumption, and capacity or leakage requires a new rule.