9.4-9.7 - Maxwell-Boltzmann Distributions And Catalysts
Molecules in a gas have a distribution of energies. Use Maxwell–Boltzmann curves and reaction profiles to explain how heating and catalysts increase reaction rate by different mechanisms.
Why Molecules Do Not All Have The Same Energy
A reaction mixture at a fixed temperature does not contain molecules that all move with the same energy. Some molecules have low energy, some have moderate energy, and a small fraction have very high energy. Rate depends strongly on that high-energy fraction, because only collisions with energy at least equal to the activation energy, , can lead to reaction.
Maxwell-Boltzmann distribution
The distribution of molecular energies in a sample of gas at a given temperature, plotted as number (or proportion) of molecules against energy.
For this lesson, read it qualitatively:
| Feature of the distribution | Chemical meaning |
|---|---|
| x-axis: molecular energy | molecules further right have greater energy |
| y-axis: number or proportion of molecules | a taller curve at that energy means more molecules have that energy |
| area under the whole curve | total number of molecules for a number distribution, or total proportion 1 for a normalised distribution |
| vertical line | minimum energy needed for successful reaction |
| area to the right of | molecules with enough energy to react |
[DIAGRAM: asset_name: Maxwell Boltzmann Temperature; asset_slug: edexcel_a_level_chemistry_l047_maxwell_boltzmann_temperature; recommended_method: deterministic_chart; description: Maxwell-Boltzmann distribution showing a lower-temperature curve with a higher peak, a higher-temperature curve with a broader lower peak, and a larger high-energy tail beyond Ea at higher temperature.]
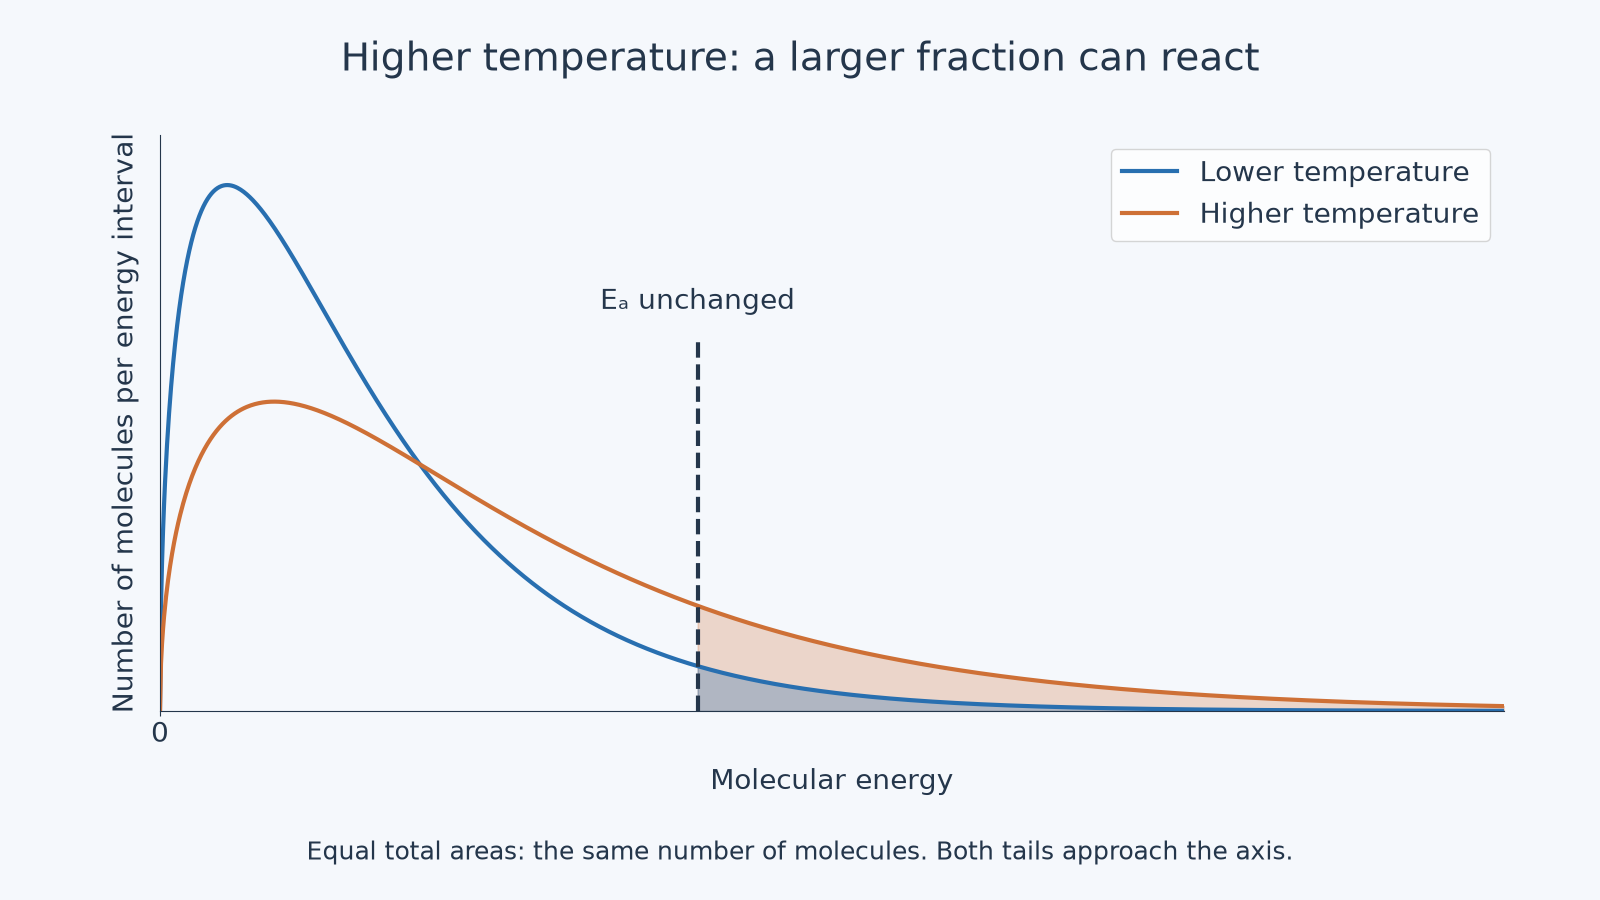
The graph starts at the origin because no molecules have exactly zero kinetic energy in this model. It rises to a peak because many molecules have intermediate energies, then falls away because very high energies are rare. There is no finite maximum molecular energy in the model: the tail approaches the energy axis without touching it. The tail on the right is small, but it matters a lot: a small change in the tail beyond can make a large difference to reaction rate.
Worked example: locating the successful fraction
A reaction has an activation energy marked on a Maxwell-Boltzmann distribution. To identify the molecules able to react, do not look at the peak of the curve. Look at the area to the right of the line.
If the line is far to the right, only a small fraction of molecules have enough energy. If the line is further left, a larger fraction of molecules have enough energy. That is why the position of relative to the tail is more important than the exact height of the peak.
Temperature Changes The High-Energy Tail
When temperature increases, the molecules have a greater mean kinetic energy. The Maxwell-Boltzmann distribution changes shape: the peak becomes lower, the curve becomes broader, and the tail to the right becomes larger. The total area under the curve stays the same if the same number of molecules is being considered.
The key temperature explanation is not just "particles move faster". It is:
higher temperature → distribution shifts and broadens → larger fraction of molecules have → more successful collisions per unit time → faster reaction
The same idea works in reverse. Lowering temperature gives fewer molecules with energy at least , so the rate decreases. In many reactions the change is large because the line sits in the high-energy tail, where a small redistribution of molecules can noticeably change the successful fraction.
Worked example: heating a reaction mixture
A reaction is slow at room temperature but faster when warmed. On a Maxwell-Boltzmann diagram, warming does not move the activation energy line for the same uncatalysed reaction. Instead, it changes the distribution of molecular energies.
At the higher temperature, the curve is lower and broader, with more of the area beyond . This means a larger fraction of collisions have enough energy to overcome the activation energy barrier. The rate increases because successful collisions become more frequent.
Common-error contrast
Weak answer: "The activation energy is lower at higher temperature."
Better answer: "At higher temperature, a larger fraction of molecules have energy greater than or equal to the same activation energy."
Activation energy belongs to the reaction pathway. Temperature changes the distribution of molecular energies; it does not normally lower the activation energy of an unchanged reaction pathway.
A Catalyst Provides A Lower-Energy Route
A catalyst changes the sequence of steps by which reactants become products. It is regenerated when that sequence is complete.
Catalyst
A substance that increases the rate of a reaction without being used up overall, by providing an alternative reaction route with a lower activation energy.
A catalyst does not provide energy to molecules, and it does not make the reaction products more stable.
[DIAGRAM: asset_name: Catalysed Reaction Profile; asset_slug: edexcel_a_level_chemistry_l047_catalysed_reaction_profile; recommended_method: deterministic_chart; description: Reaction profile for the same exothermic reaction showing reactants and products at unchanged energy levels, with an uncatalysed pathway having a higher peak and a catalysed pathway having a lower peak.]
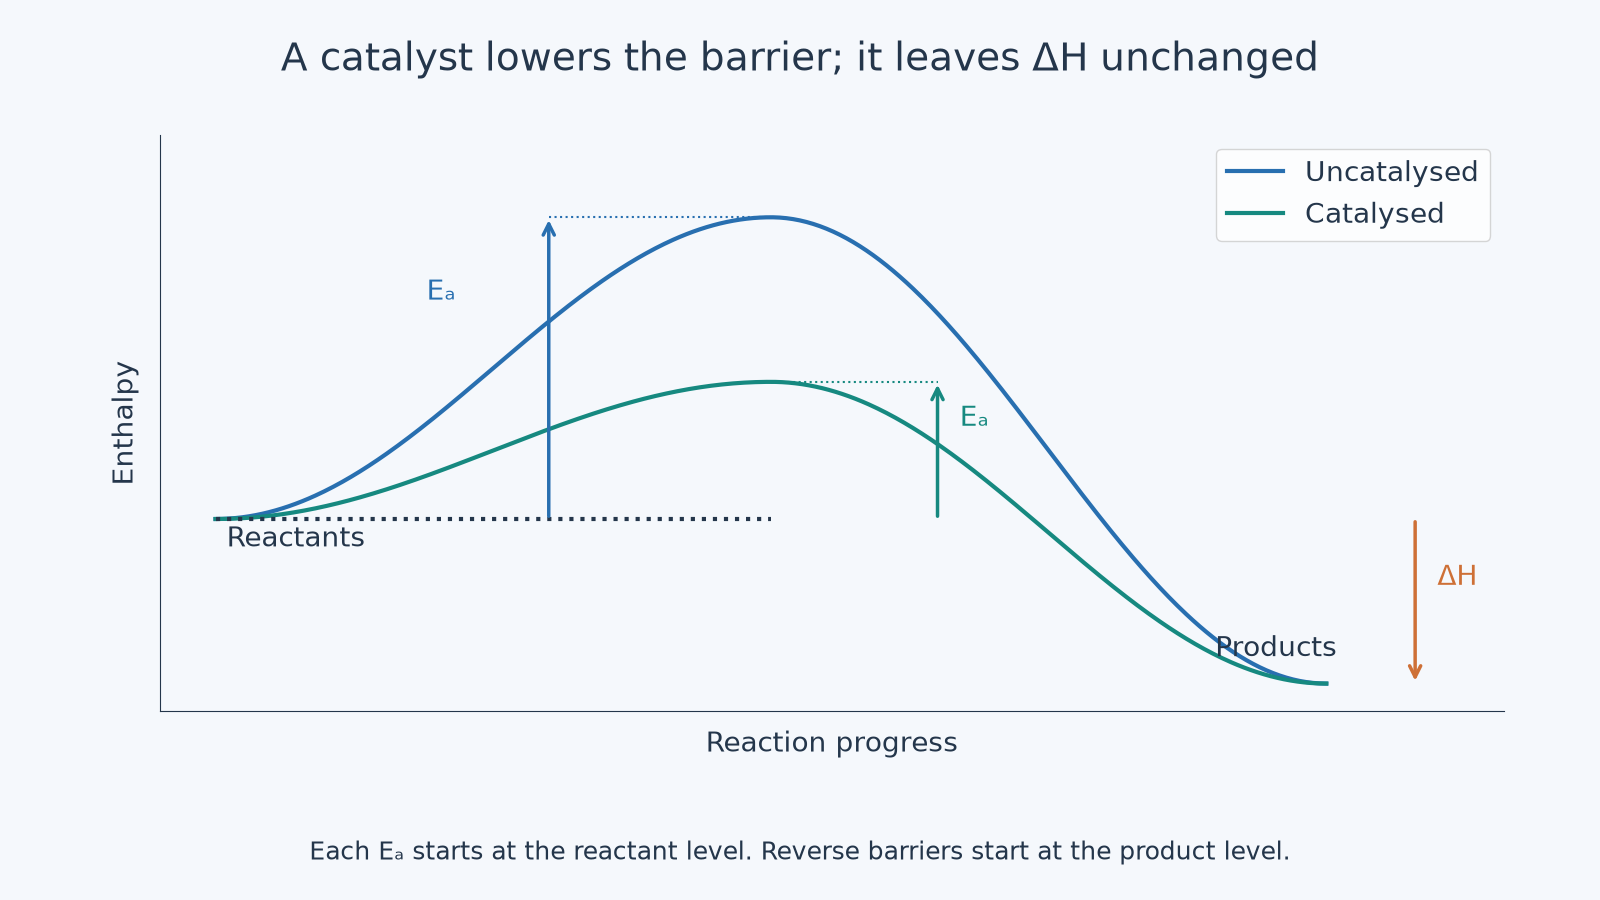
In a reaction profile diagram, activation energy is measured from the reactant energy level up to the highest point on the pathway. A catalysed pathway has a lower peak, so the activation energy is smaller. The reactants and products remain at the same energy levels, so the enthalpy change, , is unchanged.
Continue this lesson.
You’re previewing NovaLearn without an account. Create a free account to read the rest.
Create free account