12.16-12.17 - Titration Curves And Indicators
Read and sketch titration curves for strong and weak acids and bases. Connect each equivalence region to the ions present, then choose an indicator whose transition range gives a precise endpoint.
What A Titration Curve Shows
A student titrates an unknown acid with sodium hydroxide and records the after each small addition. The numbers are useful, but the curve tells the story faster: where the solution begins, how gradually the changes, where neutralisation is complete, and whether an indicator could give a sharp endpoint.
A titration curve is usually drawn with on the y-axis against volume of acid or base added, in , on the x-axis.
Equivalence point
The point in a titration at which acid and base have reacted in the exact mole ratio of the neutralisation equation.
For a monobasic acid and a base that accepts one proton, the reacting ratio is usually .
Endpoint
The point at which the indicator is seen to change colour.
A good indicator makes the endpoint close to the equivalence point by changing colour during the steep part of the titration curve.
If base is added to acid, the curve rises. If acid is added to base, the same chemical ideas appear in reverse and the curve falls. Questions may use either orientation, so always read the axis label before interpreting the curve.
Common-error contrast. Equivalence point does not mean " 7" in every titration. It means stoichiometric neutralisation. The at equivalence depends on whether the salt formed contains ions that act as weak acids or weak bases in water.
The Four Curve Shapes
The shape of a titration curve is controlled by two questions: is the acid strong or weak, and is the base strong or weak?
[DIAGRAM: asset_name: Four Titration Curves; asset_slug: edexcel_a_level_chemistry_l057_four_titration_curves; recommended_method: deterministic_chart; description: Pale-background colour graph showing typical pH titration curves for strong acid with strong base, weak acid with strong base, strong acid with weak base, and weak acid with weak base, all with the equivalence volume marked.]
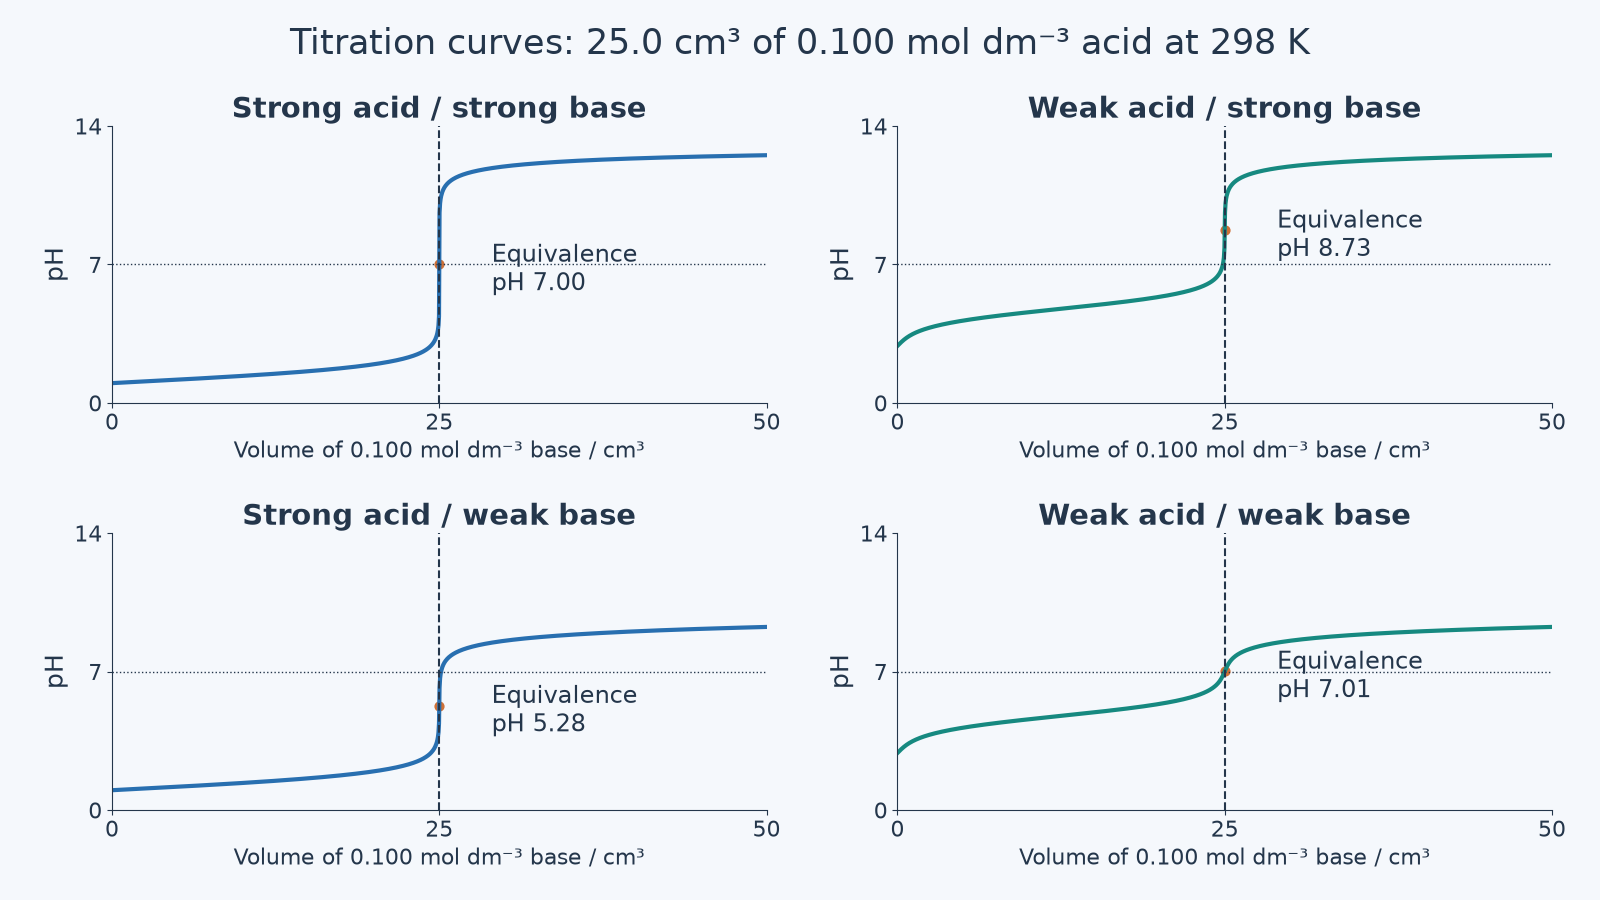
For curves drawn with base added to acid:
| Acid and base combination | Starting | Equivalence | Shape clue |
|---|---|---|---|
| Strong acid + strong base | Very low, often near 1 for acid | About 7 at 298 K | Large, very steep vertical section |
| Weak acid + strong base | Higher than a strong acid of the same concentration | Above 7 | Smaller vertical section; rises gently before equivalence |
| Strong acid + weak base | Very low | Below 7 | Steep section is lower; final is not as high as with a strong base |
| Weak acid + weak base | Moderately acidic | Depends on relative acid/base strength, often close to 7 if similar | No sharp vertical section |
The weak acid-strong base equivalence point is above 7 because the salt contains the conjugate base, . It reacts slightly with water:
The strong acid-weak base equivalence point is below 7 because the salt contains the conjugate acid, . It reacts slightly with water:
A weak acid-weak base titration does not produce a large rapid change near equivalence. That is why it is difficult to find a reliable endpoint using a normal acid-base indicator.
Sketching And Interpreting Curves
To sketch a titration curve, do not try to memorise exact numbers. Put in the key features:
- Correct axes: against volume added.
- Correct starting region.
- Correct direction: rising if base is added, falling if acid is added.
- Correct equivalence region: below, at, or above 7.
- Correct steepness: large jump for strong/strong, smaller jump for one weak reagent, no sharp jump for weak/weak.
- Sensible final controlled by the reagent in excess.
Worked example: identifying a curve.
A curve for 0.100 acid starts at about 3, rises gradually, then has a steep section centred above 7. After the equivalence point, the levels off above 12 because excess sodium hydroxide has been added. Deduce the acid-base combination.
The start at 3 suggests the acid is weak, because a strong acid of the same concentration would start much lower. The high final shows a strong base is in excess after equivalence. The equivalence point above 7 also fits a weak acid-strong base titration because ions make the solution alkaline.
So the combination is:
weak acid + strong base
Continue this lesson.
You’re previewing NovaLearn without an account. Create a free account to read the rest.
Create free account