19C.6-19C.8 - Chromatography And Mass Spectrometry
Chromatography separates mixture components because they spend different proportions of time in mobile and stationary phases. Read a chromatogram, calculate Rf, interpret retention times and decide how mass spectra strengthen an identification.
Why Chromatography Separates Mixtures
A food dye, medicine sample or reaction product can look like one coloured spot or one colourless liquid, but it may contain several substances. Chromatography is useful because it can separate those components without requiring each component to be known before the experiment starts.
All chromatographic methods have the same core idea:
mixture + mobile phase + stationary phase → components travel at different speeds
Mobile phase
The phase that moves through or over the stationary phase, carrying the components: a solvent moving up paper or a liquid or gas flowing through a column.
Stationary phase
The phase that does not move: for example a thin silica coating, a liquid retained on a support, or material packed inside a column. In conventional paper chromatography the paper supports a stationary film of water; in TLC the stationary phase is commonly solid silica.
A component that spends more time dissolved in, or carried by, the mobile phase travels further or leaves the column sooner. A component that is more strongly attracted to the stationary phase travels less far or leaves the column later.
That means chromatography is not separating by "lightness" or by the amount of sample placed on the baseline. It separates because the substances have different balances of attraction or solubility between the two phases.
Reading One-Way Chromatograms
In a one-way chromatogram, the mobile phase moves in one direction from a baseline. A spot or band appears where a component has travelled to by the time the solvent front is marked.
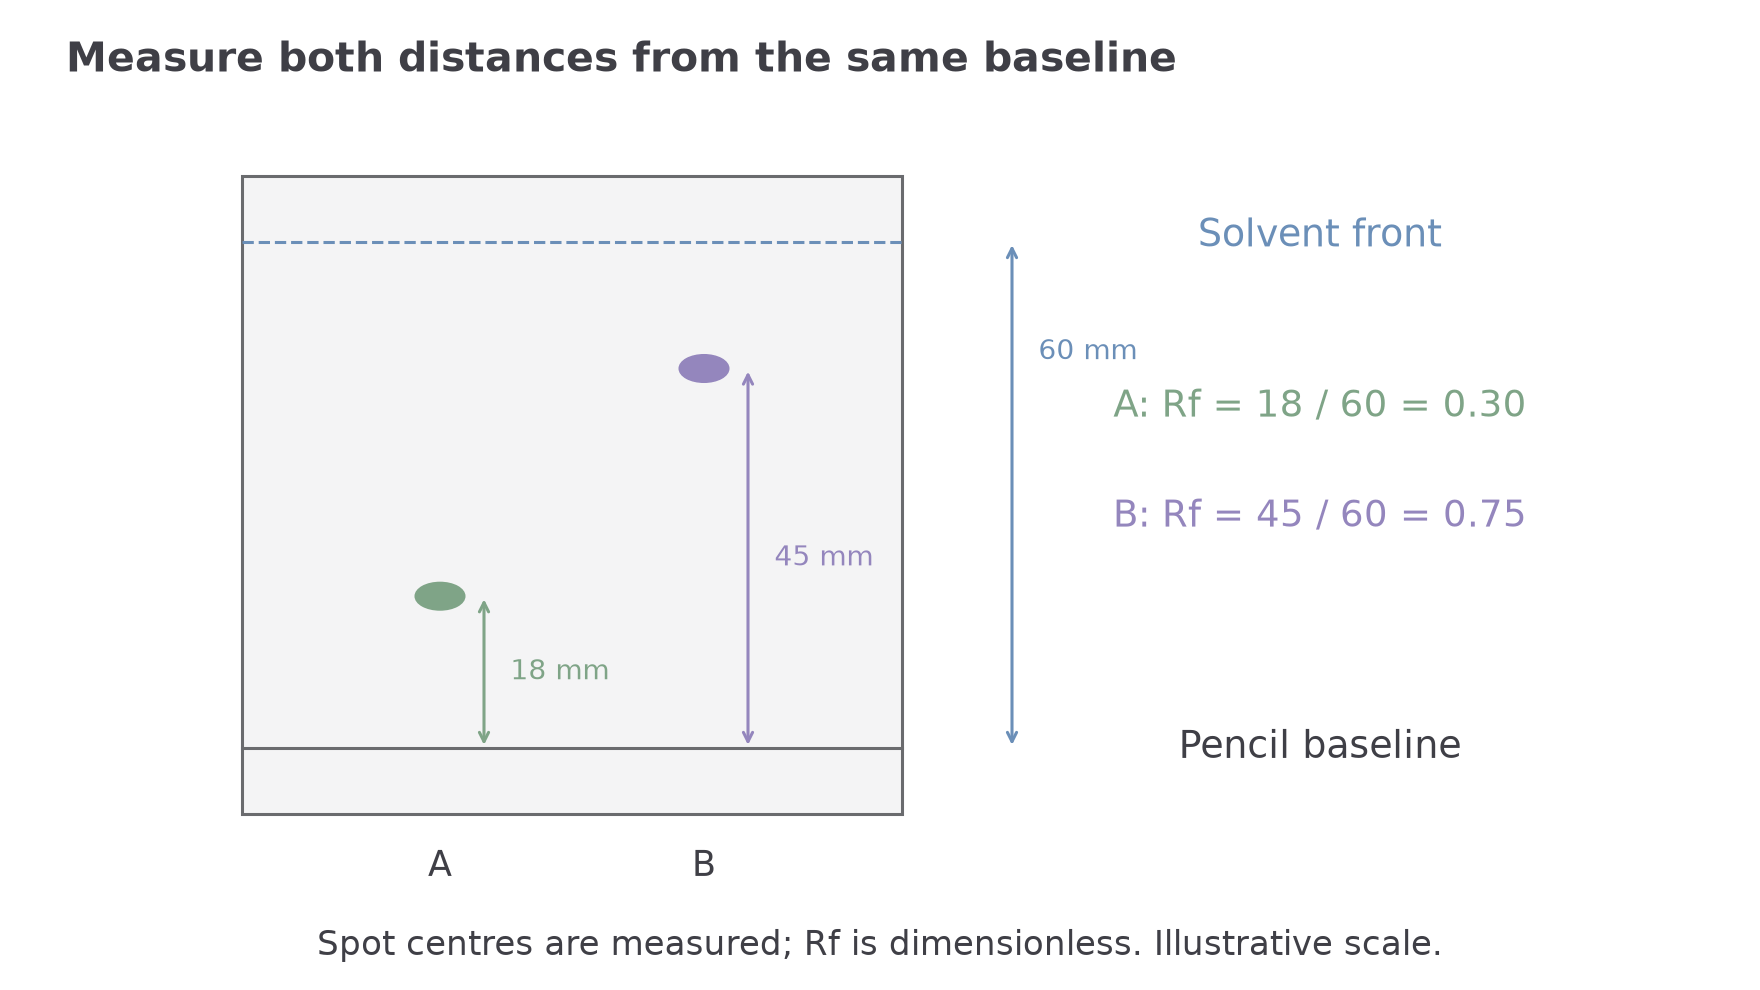
The important distances are measured from the same starting line:
| Measurement | How to measure it | Why it matters |
|---|---|---|
| Distance moved by component | baseline to the centre of the spot | the component's travel distance |
| Distance moved by solvent front | baseline to the solvent front | the maximum distance the mobile phase moved |
The baseline should be drawn in pencil, because pencil graphite is insoluble in many common chromatography solvents and will not normally travel with the mobile phase. Ink can dissolve and create extra spots, which would make the chromatogram unreliable.
Apply small concentrated spots and let each application dry, so components do not spread into overlapping bands. Keep the pencil baseline above the solvent surface to avoid washing the sample directly into the reservoir. Mark the solvent front immediately after removal, before it evaporates, so its distance can be measured reliably. Dry the plate before applying a suitable locating agent for colourless components.
If a sample gives several spots, the sample contains several components under those chromatographic conditions. If two samples produce a spot at the same position, that is evidence that a component may be the same, but a stronger identity claim needs the same conditions and often a reference standard or another analytical method.
Common-error contrast
Tempting but wrong: "A spot that is higher up the chromatogram must be present in a larger amount."
Correct: height on the chromatogram shows how far that component travelled relative to the solvent front. Amount is more closely related to spot intensity or area, and even then only with calibration and controlled conditions.
Calculating Rf Values
is a ratio that compares how far a component has moved with how far the solvent front has moved.
Rf value
Both distances are measured from the baseline (to the centre of the spot); has no unit.
Both distances must use the same unit, so the unit cancels. An value has no unit. For a normal one-way chromatogram where the spot is between the baseline and solvent front, the value lies between 0 and 1.
A chromatogram has a baseline, one spot and a solvent front. The centre of the spot is above the baseline. The solvent front is above the baseline.
Calculate the value.
| Step | Reasoning | Value |
|---|---|---|
| Component distance | baseline to centre of spot | |
| Solvent-front distance | baseline to solvent front | |
| Ratio | 0.45 |
The chemical interpretation is that this component travelled 45 percent of the solvent-front distance under these conditions. If a different solvent, stationary phase or temperature were used, the value could change.
Guided practice
Complete the route for a spot whose centre is from the baseline when the solvent front is from the baseline.
Answer:
Calculation check
In a calculate question, show the substitution and do not attach a final unit:
Do not write . The centimetres cancelled in the ratio.
[DIAGRAM: asset_name: One-way chromatogram showing baseline-to-centre 18 and45mm and solvent front60mm, Rf0.30and0.75; asset_slug: edexcel_9ch0_rf_chromatogram; recommended_method: deterministic_chart; description: One-way chromatogram showing baseline-to-centre 18 and45mm and solvent front60mm, Rf0.30and0.75]
Continue this lesson.
You’re previewing NovaLearn without an account. Create a free account to read the rest.
Create free account