7B.2 - Infrared Spectroscopy
Infrared spectra show which bonds absorb radiation, helping identify functional groups in an unknown. Learn to read absorption positions and shapes, predict them from structures and combine IR evidence with mass spectra and practical observations.
What An IR Spectrum Can Prove
Two colourless organic liquids may look identical in a sample vial. One could be an alcohol, one could be a ketone, and a third unknown could be a carboxylic acid. Infrared spectroscopy helps because different bonds absorb infrared radiation at characteristic wavenumber ranges when their vibrations interact with the radiation.
An IR spectrum is usually plotted as transmittance against wavenumber:
| Feature on the spectrum | Meaning in the sample |
|---|---|
| A downward peak or trough | Infrared radiation has been absorbed at that wavenumber |
| Wavenumber in | Number of waves per centimetre; higher wavenumber is usually shown on the left |
| Region above about | Many useful functional-group stretches appear here |
| Region below about | Fingerprint region (see below) |
Fingerprint region
The part of an IR spectrum below about . Its complex pattern is characteristic of the whole molecule, so it is used to compare a sample with a reference spectrum rather than to assign single bonds.
The key move is not "spot a peak and name a compound". The key move is:
absorption wavenumber → matching Data Booklet range → bond or functional group → conclusion with limits
For example, a strong absorption near is evidence for a bond, but several carbonyl-containing functional groups can absorb in that region. A broad absorption from about together with a absorption is much stronger evidence for a carboxylic acid.
A dip is an absorption
A dip in an IR spectrum is not the molecule giving off radiation: it is an absorption. Less radiation reaches the detector at that wavenumber because bonds in the sample absorb infrared energy for vibrations. The spectrum is evidence about bonds present, not a direct photograph of the molecule.
Using The Data Booklet Ranges
Use the IR absorption table in the Data Booklet. You do not need to memorise every number perfectly, but you do need to recognise the characteristic regions and quote the relevant range when data are supplied.
| Functional-group evidence | Data Booklet range / | How to use it |
|---|---|---|
| Alkane stretch | Common in alkyl chains; not enough to identify a functional group on its own | |
| Alkene stretch | Above ; use with a absorption if possible | |
| Aldehyde stretch | and | Often a pair of bands; useful for separating aldehydes from ketones |
| Isolated alkene stretch | Evidence for an alkene double bond, especially with alkene | |
| Alcohol or phenol stretch | Broad absorption; alcohol evidence when no carbonyl is present | |
| Amine stretch | May overlap the alcohol region; use shape and other evidence | |
| Aldehyde stretch, saturated alkyl | Carbonyl evidence; aldehyde bands help confirm aldehyde rather than ketone | |
| Ketone stretch, alkyl | Carbonyl evidence; absence of aldehyde and acid matters | |
| Carboxylic acid stretch, alkyl | Use with the broad acid ; the range overlaps ketones | |
| Carboxylic acid stretch | Very broad; the decisive companion evidence for a carboxylic acid |
Some ranges overlap. That is why a good answer normally says more than "there is a peak at ". It names the evidence and rejects alternatives where the spectrum allows it.
Common-error contrast
does not automatically mean "ketone". It lies in the ketone range, but it can also match a carboxylic-acid range. If the spectrum also has a very broad absorption, the better deduction is carboxylic acid.
Worked Deduction From An Unknown Spectrum
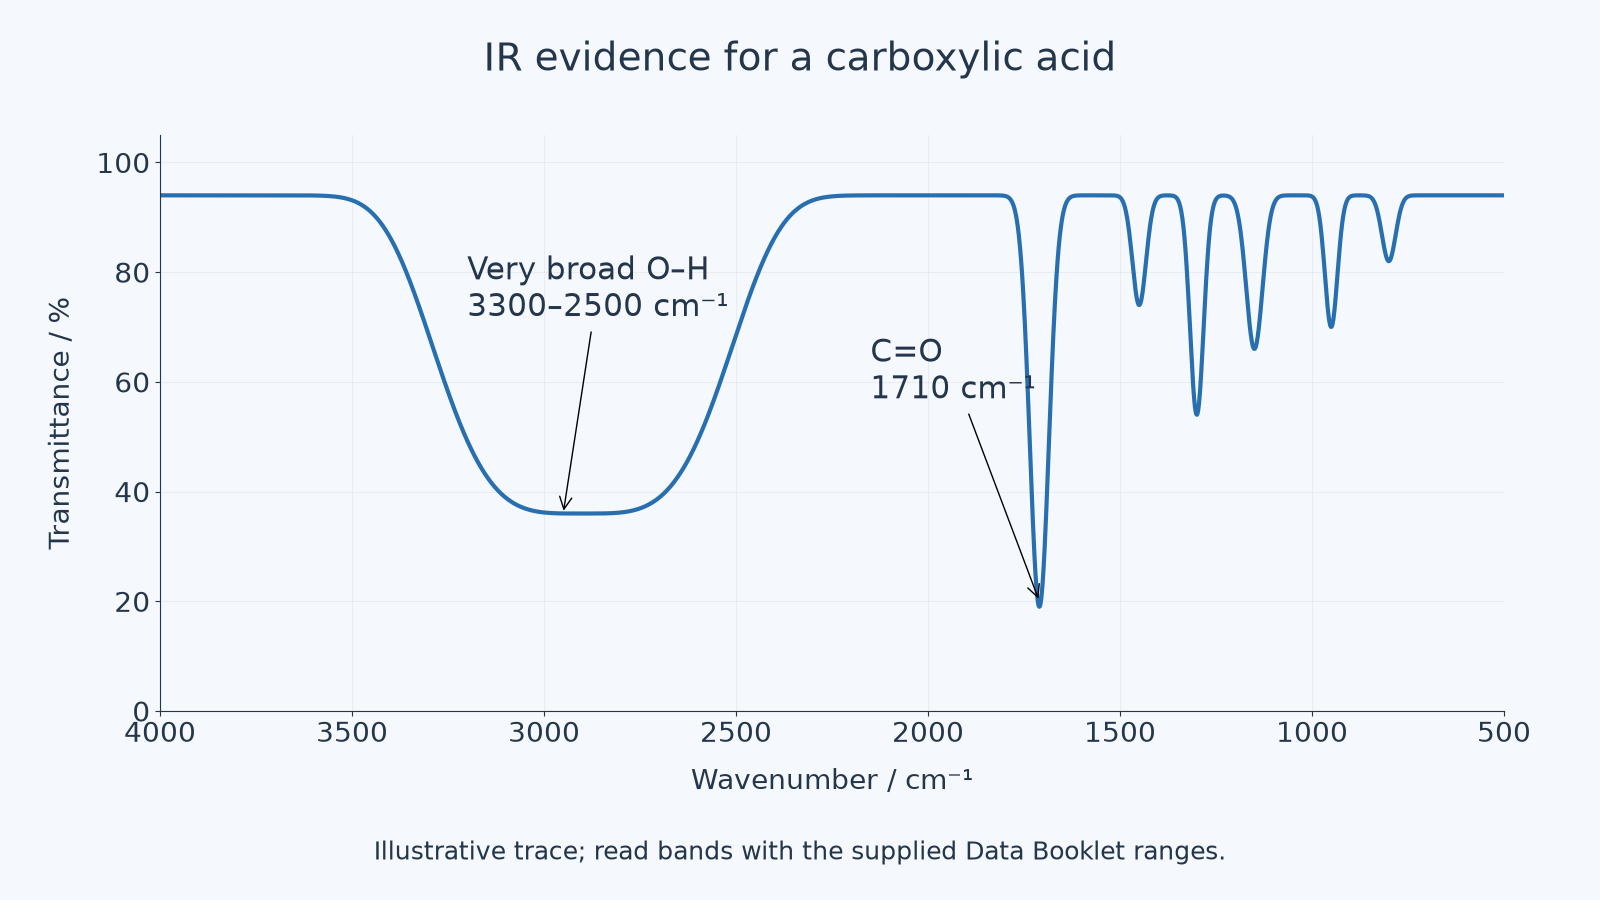
The spectrum below is a deterministic teaching spectrum for an unknown organic compound. Treat it as a data stimulus: read the labelled absorptions first, then decide what they prove.
[DIAGRAM: asset_name: IR Unknown Carboxylic Acid Spectrum; asset_slug: edexcel_a_level_chemistry_l041_ir_unknown_carboxylic_acid_spectrum; recommended_method: deterministic_chart; description: Infrared spectrum of an unknown organic compound showing a very broad O-H absorption from 3300 to 2500 cm^-1, a strong C=O absorption near 1710 cm^-1, and alkyl C-H absorptions near 2960 to 2850 cm^-1.]
Worked example
Question: An unknown organic compound has a very broad absorption from about , a strong absorption at , and absorptions around . Deduce the functional group present and justify your answer.
Model route:
- The very broad absorption from matches the stretch of a carboxylic acid.
- The strong absorption at matches a stretch, and it lies in the carboxylic-acid carbonyl range for an alkyl carboxylic acid.
- The absorptions around are consistent with alkane , so the molecule may contain an alkyl part.
- The acid and evidence together support the presence of a carboxylic acid group, .
Chemical interpretation: IR strongly supports a carboxylic-acid functional group here. It does not, by itself, tell you whether the compound is methanoic acid, ethanoic acid, propanoic acid, or another carboxylic acid. A full structure needs other evidence, such as molecular mass, formula, NMR data or comparison with a reference spectrum.
Guided practice
An unknown has a strong absorption at , weak absorptions at and , and alkyl absorptions near . There is no broad absorption.
Complete the reasoning:
| Evidence | Deduction |
|---|---|
| strong absorption | bond present |
| and | aldehyde bands |
| no broad | not supported as a carboxylic acid |
Expected conclusion: the spectrum gives evidence for an aldehyde functional group. The aldehyde absorptions separate it from a ketone, which would have a carbonyl absorption but not the aldehyde pair.
Predicting Absorptions From Structures
Prediction is the reverse of deduction. Start with the structure, list the bonds and functional groups present, then state the absorption range and any important shape.
Prediction route
structure → functional groups and key bonds → Data Booklet ranges → expected IR absorptions
| Compound or structural feature | Expected absorptions to predict |
|---|---|
| Alkane such as hexane | stretch at |
| Alkene such as propene | alkene at ; isolated at ; alkyl may also appear |
| Alcohol such as propan-1-ol | broad alcohol at ; alkyl at |
| Aldehyde such as propanal | at ; aldehyde at and ; alkyl also present |
| Ketone such as propanone | alkyl ketone at ; alkyl at |
| Carboxylic acid such as ethanoic acid | carboxylic-acid at ; very broad acid at ; alkyl if an alkyl group is present |
| Amine such as ethylamine | amine at ; alkyl if an alkyl group is present |
Worked prediction: pentanal and pentan-2-one
Pentanal and pentan-2-one both contain a carbonyl group, so both should have a strong absorption near . The distinction is the aldehyde hydrogen.
For pentanal, predict:
- :
- aldehyde : and
- alkyl :
For pentan-2-one, predict:
- :
- alkyl :
- no aldehyde pair expected
Chemical interpretation: the carbonyl peak alone says both are possible carbonyl compounds. The aldehyde pair is the extra IR evidence that points to an aldehyde rather than a ketone.
Continue this lesson.
You’re previewing NovaLearn without an account. Create a free account to read the rest.
Create free account