8.1-8.4 - Enthalpy Changes
Enthalpy changes describe heat transferred at constant pressure. Connect temperature observations to the correct sign and energy levels, then use standard conditions and precise definitions to describe reaction, formation, combustion and neutralisation.
Heat Change At Constant Pressure
When magnesium reacts with dilute hydrochloric acid, the test tube becomes warm. When ammonium nitrate dissolves in water in a cold pack, the surroundings become colder. In both cases, the important question is not just "did the temperature change?" but "which way did energy move between the chemical system and the surroundings?"
Enthalpy change, \(\Delta H\)
The heat energy change measured at constant pressure.
The chemical reaction or process being studied is the system. The rest of the mixture, apparatus, air, thermometer and your hand are part of the surroundings used to observe the heat transfer.
Use this sign convention:
Sign of an enthalpy change
in . Exothermic: (heat released to the surroundings). Endothermic: (heat absorbed from the surroundings). The sign always refers to the chemical system.
If the system releases heat to the surroundings, the products have lower enthalpy than the reactants and is negative. This is an exothermic change. If the system absorbs heat from the surroundings, the products have higher enthalpy than the reactants and is positive. This is an endothermic change.
| Type of change | Energy movement | Surroundings observation | Enthalpy sign |
|---|---|---|---|
| Exothermic | heat leaves the system | temperature of surroundings tends to rise | |
| Endothermic | heat enters the system | temperature of surroundings tends to fall |
The sign belongs to the system, not to the thermometer. A temperature rise in the surroundings usually means the system has lost heat, so the reaction enthalpy change is negative.
Worked example: assigning the sign
Question: A reaction in an insulated cup causes the solution temperature to rise. Is the reaction exothermic or endothermic, and what is the sign of ?
Model answer route:
- The reacting chemicals are the system.
- The bulk solution and cup are the immediate surroundings used to observe the heat change.
- The surroundings warm up, so heat has been transferred from the system to the surroundings.
- The system has lost enthalpy, so the products are at lower enthalpy than the reactants.
- The reaction is exothermic and is negative.
Chemical interpretation: the temperature observation is evidence for the direction of heat transfer, but the sign is defined for the chemical system.
Constructing Enthalpy Level Diagrams
An enthalpy level diagram shows the relative enthalpy of reactants and products. It is not a picture of individual molecules moving, and the horizontal spacing is not usually a measured time or distance. The key feature is the vertical difference between the reactant level and the product level.
[DIAGRAM: asset_name: Enthalpy Level Signs; asset_slug: edexcel_a_level_chemistry_l042_enthalpy_level_signs; recommended_method: deterministic_chart; description: Two enthalpy level diagrams comparing exothermic and endothermic reactions, with reactants and products at different enthalpy levels and Delta H arrows showing negative and positive signs.]
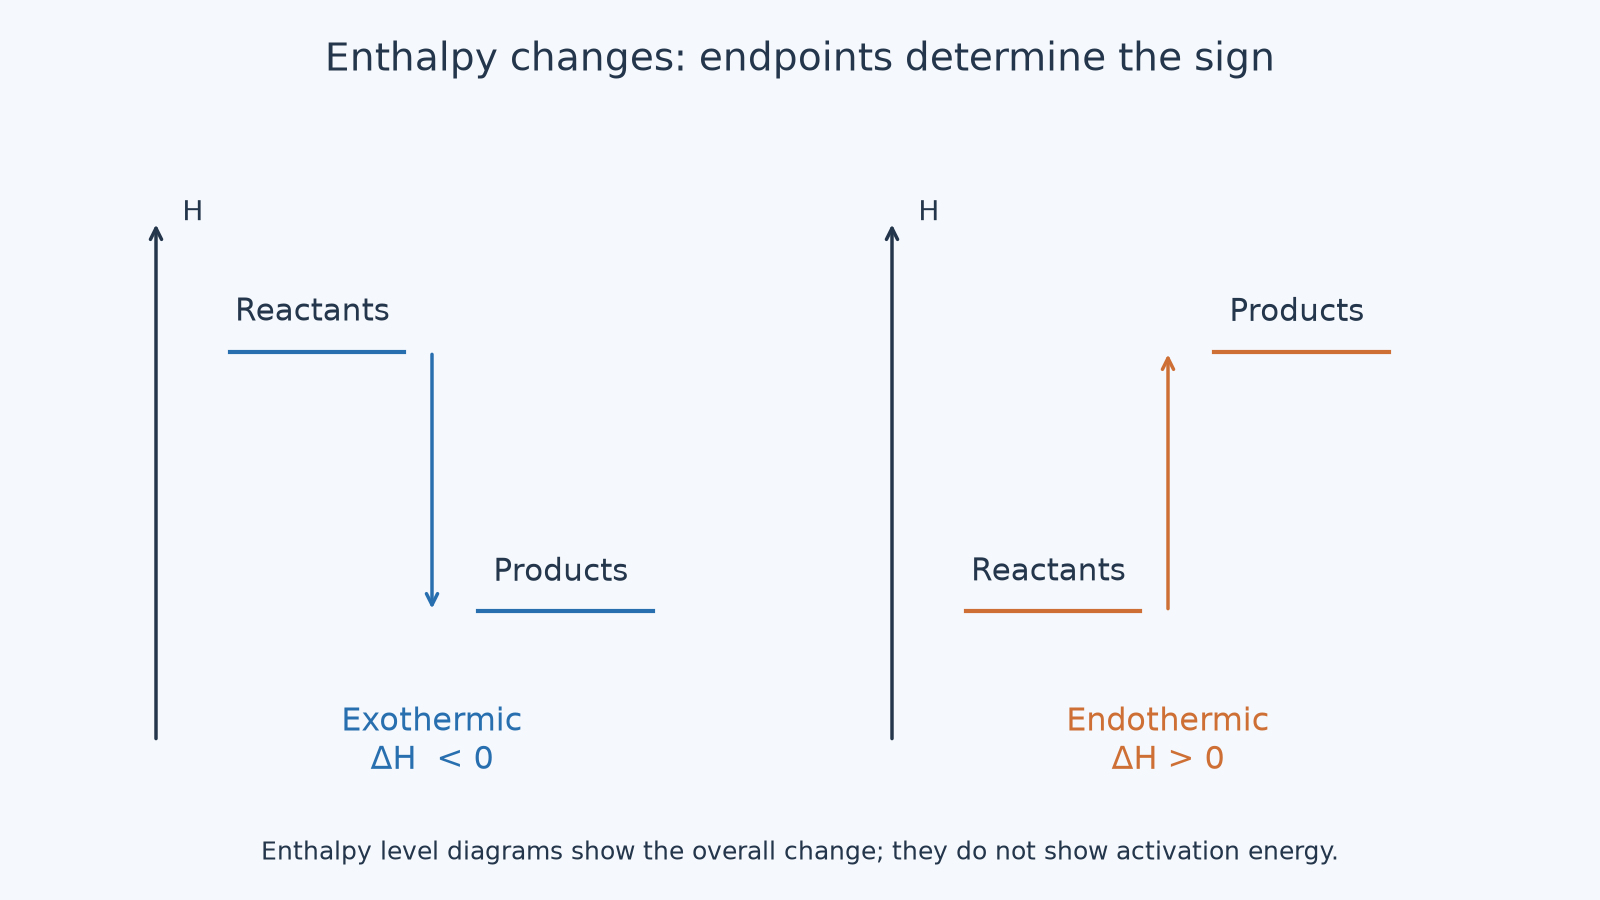
To construct a level diagram:
- Draw a vertical axis labelled .
- Put reactants and products on horizontal levels.
- For an exothermic reaction, draw products lower than reactants.
- For an endothermic reaction, draw products higher than reactants.
- Draw a vertical arrow showing the enthalpy change.
- Attach the correct sign: negative for exothermic, positive for endothermic.
For example, if a reaction has , the product level must be below the reactant level. If a reaction has , the product level must be above the reactant level.
Common-error contrast
Do not decide the sign from whether the arrow points "down the page" or "up the page" alone. The sign comes from the enthalpy difference:
- products lower than reactants → negative
- products higher than reactants → positive
A badly drawn arrow can be corrected; a wrong relative level shows a wrong model.
Guided practice
Level Diagrams And Reaction Profiles
One distinction matters here: activation energy is not shown in enthalpy level diagrams, but it is shown in reaction profile diagrams. A level diagram compares the enthalpy of the start and the finish. A reaction profile adds a pathway with an energy barrier between them.
[DIAGRAM: asset_name: Level Vs Profile; asset_slug: edexcel_a_level_chemistry_l042_level_vs_profile; recommended_method: deterministic_chart; description: Comparison of an enthalpy level diagram, which shows only Delta H between reactants and products, with a reaction profile diagram, which also shows activation energy.]
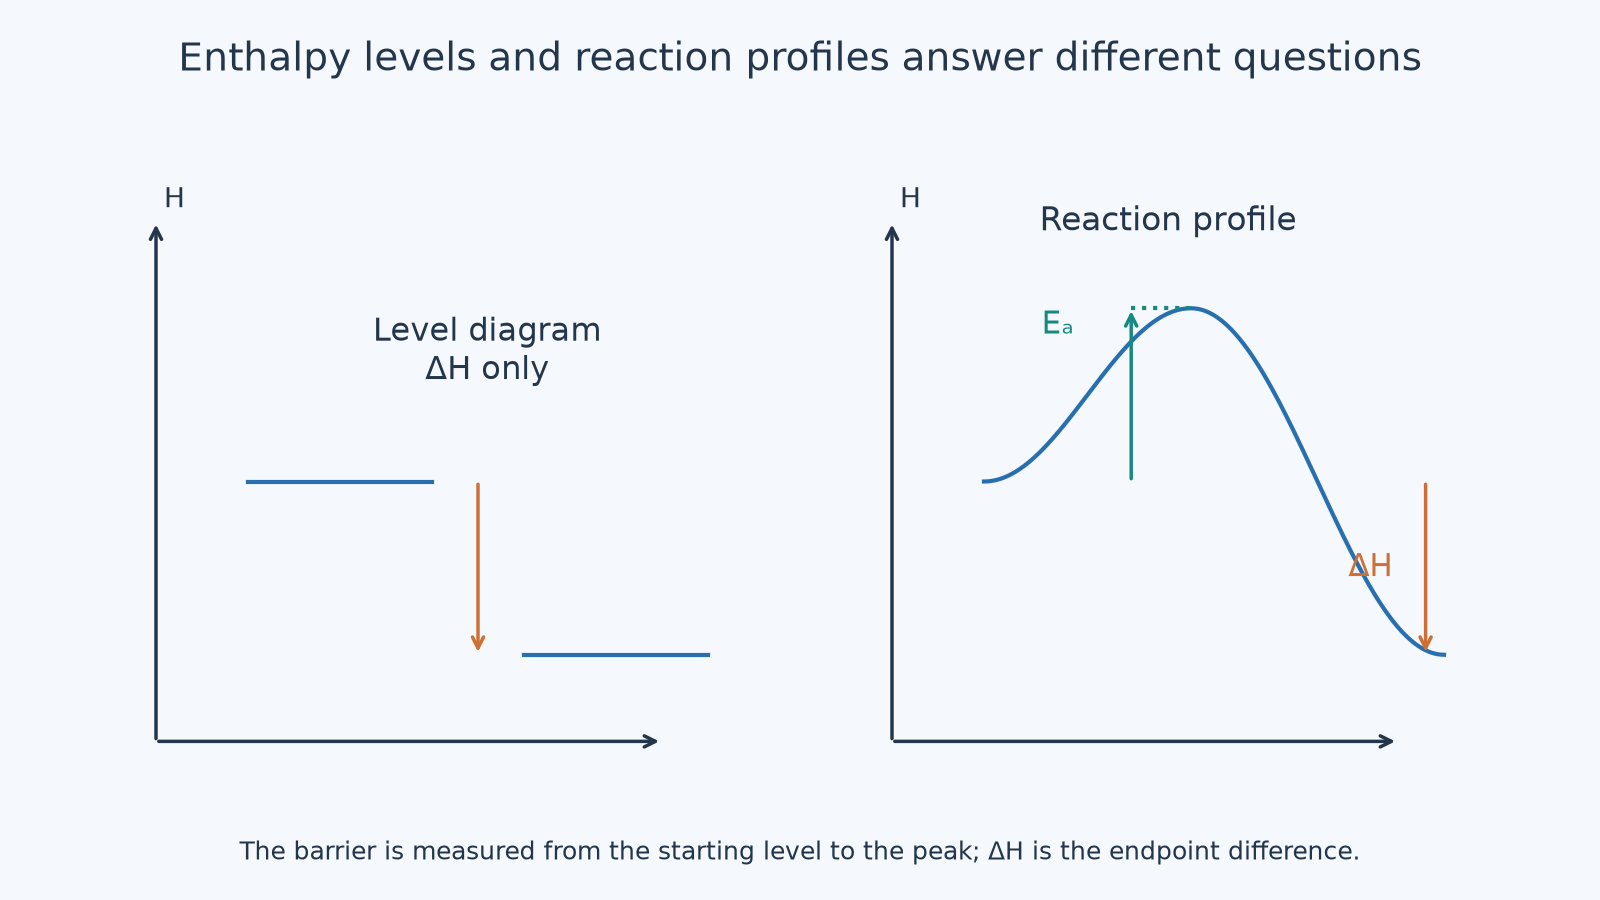
The reaction profile is useful when the question is about rate, catalysts or activation energy. The enthalpy level diagram is useful when the question is about the overall enthalpy change and its sign.
| Diagram type | What it must show | What it must not be used to claim |
|---|---|---|
| Enthalpy level diagram | relative enthalpy of reactants and products; and its sign | activation energy or detailed pathway |
| Reaction profile diagram | reactants, products, pathway curve, activation energy and | exact molecular pathway unless the data give it |
Two diagrams, two questions
The reactions considered here have an activation barrier, but that does not put a hump on every diagram. A reaction profile shows the pathway and activation energy; an enthalpy level diagram only compares reactant and product enthalpy levels and shows the overall .
Continue this lesson.
You’re previewing NovaLearn without an account. Create a free account to read the rest.
Create free account