16.12 - Activation Energy From Graphs
Transform rate constants or clock times into a straight-line graph against reciprocal absolute temperature. Use the gradient to calculate activation energy, with the correct sign, units and experimental assumptions.
Finding An Energy Barrier From Rate Data
The chemical problem is simple to state but easy to mishandle: a reaction is timed at several temperatures, and the reaction is faster when warm. The data do not give activation energy directly. They show how strongly the rate constant, or a rate index, changes with temperature.
Activation energy is the minimum energy particles must have for a successful reaction. In this lesson, you are not redrawing a Maxwell-Boltzmann distribution; you are using the temperature dependence of the rate to calculate the energy barrier. A reaction with a large activation energy is especially sensitive to temperature because a temperature change has a large effect on the fraction of particles able to react.
For a reaction where the rate equation has already been established, the cleanest route uses the rate constant at different temperatures. At constant concentrations:
temperature data → values → transformed graph → gradient →
For Core Practical 14, the timed endpoint can also act as a rate index. If every run reaches the same visual endpoint, the same amount of reaction has occurred each time, so a shorter time means a faster rate. In that special practical context:
The key habit is to say what your graph has actually plotted. A graph of against and a graph of against have opposite gradient signs, even though both can give the same positive activation energy.
Common-error contrast
| Tempting move | Why it fails | Correct move |
|---|---|---|
| Plot temperature in degrees Celsius. | The Arrhenius equation uses absolute temperature. | Convert to kelvin before finding . |
| Treat a negative gradient as a negative . | For the positive activation energies considered here, the negative sign belongs to the graph relationship. | Use for against . |
| Use time directly as if it were rate. | Longer time means slower reaction. | Use , , or the derived route with the correct sign. |
Straightening The Arrhenius Equation
The Arrhenius equation relates the rate constant to temperature. It is given in questions if needed, but the graph reasoning has to be yours.
Arrhenius equation and its straight-line form
= rate constant; = frequency factor; = activation energy in ; ; in K. A graph of against is a straight line () with gradient .
The graph choices are therefore:
| Straight-line part | Arrhenius meaning |
|---|---|
| y | |
| x | |
| gradient, m | |
| intercept, c |
[DIAGRAM: asset_name: Arrhenius Plot From Rate Constants; asset_slug: edexcel_a_level_chemistry_l080_arrhenius_ln_k_plot; recommended_method: deterministic_chart; description: Pale-background colour 16:9 graph of ln k against 1/T for five rate-constant data points, showing a downward best-fit line, a labelled negative gradient triangle, the relationship gradient = -Ea/R, and the calculation cue Ea = -gradient x R]
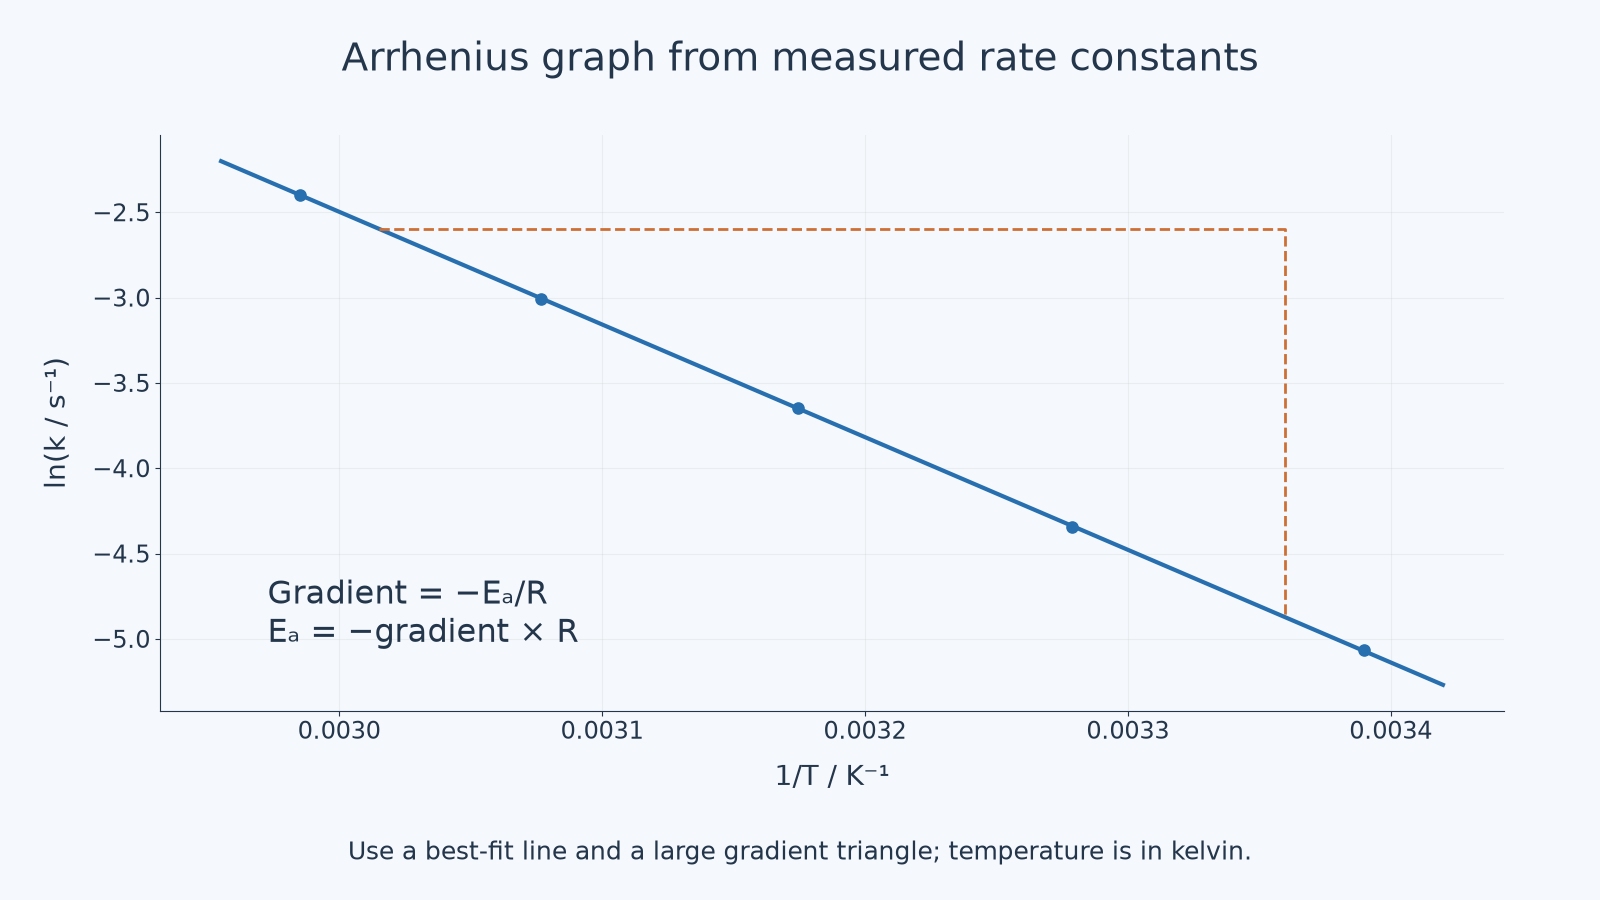
The gradient has units of kelvin because the vertical axis is a logarithmic quantity and the horizontal axis has units . Multiplying the gradient magnitude by , in , gives in . Divide by to express the answer in .
Activation Energy From A Gradient
The following original data are for a reaction whose rate constant was measured at five temperatures.
| Temperature, / K | / | ||
|---|---|---|---|
| 295 | 0.0063 | 0.003390 | -5.067 |
| 305 | 0.0130 | 0.003279 | -4.343 |
| 315 | 0.0260 | 0.003175 | -3.650 |
| 325 | 0.0495 | 0.003077 | -3.006 |
| 335 | 0.0910 | 0.002985 | -2.397 |
The graph in the previous part shows these points. To determine , draw or use a best-fit line and choose two well-separated points on the line, not necessarily two plotted data points. Suppose the line gives:
- point 1: ,
- point 2: ,
Find the gradient:
For a graph of against , gradient , so
Use the unrounded gradient internally: , then round to the graph precision (about 55 kJ mol⁻¹).
Chemical interpretation: the reaction has a positive activation energy of about . The negative graph gradient does not mean the energy barrier is negative; it means falls as increases.
Core Practical 14: Time As A Rate Index
Core Practical 14 finds activation energy for the reaction involving bromide ions and bromate(V) ions in acidic solution. The acidified bromide/bromate(V) reaction produces bromine:
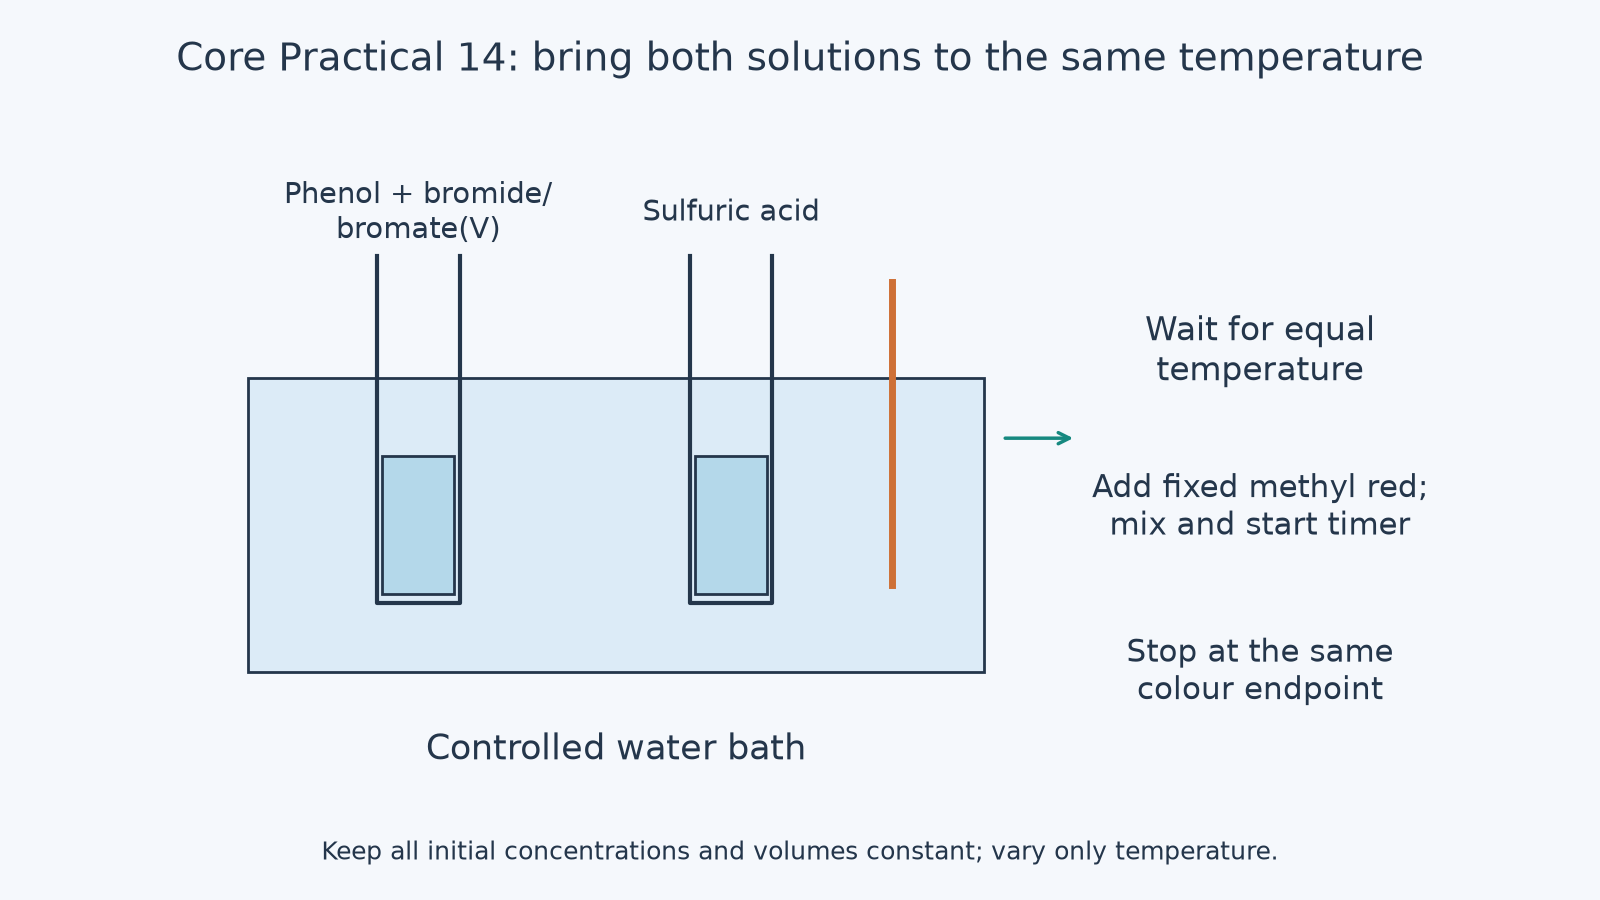
[DIAGRAM: asset_name: Core Practical 14 water-bath temperature control; asset_slug: edexcel_a_level_chemistry_l080_cp14_waterbath; recommended_method: deterministic_chart; description: Core Practical 14 water-bath temperature control, code-drawn on a pale 16:9 canvas.]
Phenol removes the bromine until the phenol has been used up:
Once the phenol has been used up, excess bromine decolourises the methyl red, giving the timed visible endpoint. The practical logic is to run the same reaction mixture at several temperatures, time the same endpoint each time, then process the temperature and time data.
A typical method decision chain is:
- Put measured volumes of phenol solution and bromide/bromate(V) solution in one boiling tube.
- Put measured sulfuric acid in a second boiling tube.
- Bring both tubes to the same water-bath temperature before mixing.
- Add the same measured amount of methyl red to each prepared mixture. Mix, start the timer immediately, and stop it at the agreed methyl-red endpoint.
- Repeat at several temperatures over a useful range.
- Convert each temperature to kelvin, calculate , then take the natural log of the time.
Continue this lesson.
You’re previewing NovaLearn without an account. Create a free account to read the rest.
Create free account