Q2 - Displacement and velocity graphs
Read velocity and acceleration from gradients, and displacement and distance from areas. You will connect two graphs of the same journey and construct a graph from a description of motion.
Velocity from a displacement graph
Can a particle travel in and still have zero average velocity? A motion graph can show exactly how: first learn what its axes tell you.
You already know
The gradient of a straight line is change in the vertical coordinate divided by change in the horizontal coordinate. Displacement is signed; distance is the length of the route. A negative velocity means motion in the chosen negative direction.
On a displacement–time graph, time is horizontal and displacement is vertical. Suppose displacement rises from to in . The constant gradient is : the particle gains of displacement each second.
Displacement gradient
For a straight displacement–time segment,
For a curved graph, instantaneous velocity is the gradient of the tangent; a chord gradient gives average velocity over its interval.
Not in the formula booklet: learn it.
A rising segment means positive velocity; a falling segment means negative velocity. Steepness gives speed. A horizontal segment means rest at a fixed position, which need not be the origin. The graph is a record of displacement, not a drawing of a hill.
Worked example 1: three straight stages
Question. The displacement–time graph joins , with seconds horizontally and metres vertically. Find the velocity on each stage.
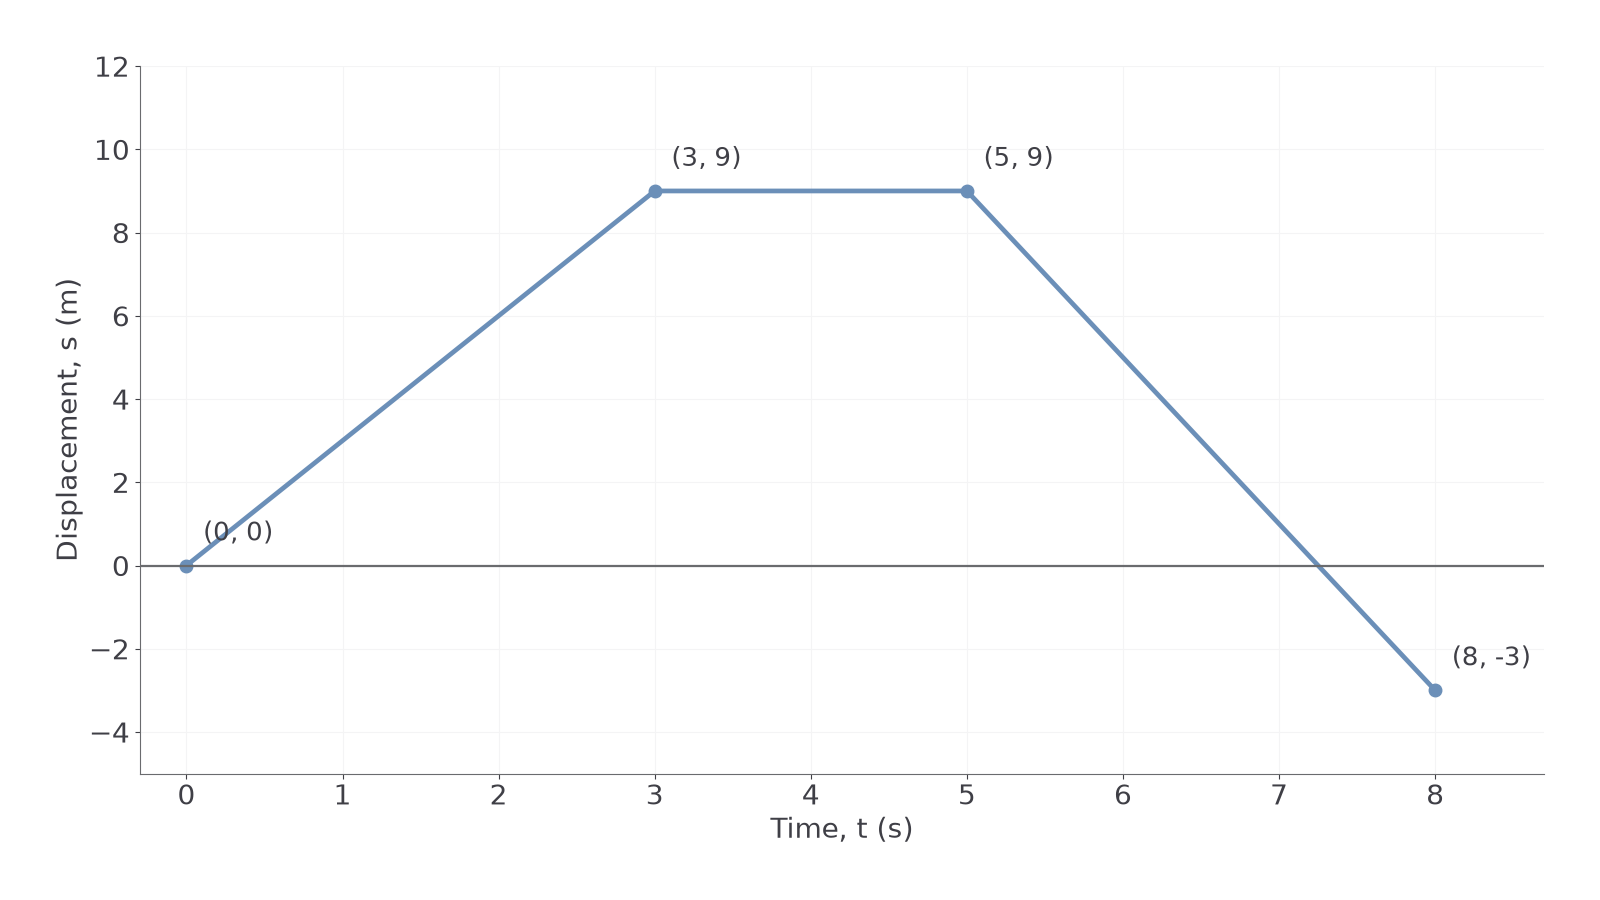
Plan. Divide the displacement change by the duration separately on each straight segment.
Why this step? Each velocity belongs to an interval; the total change over all would give only the average velocity.
Answer. The velocities are , zero and , respectively.
Check. Their displacement changes are , and metres, matching the graph.
The next example changes only the reference position, adding to every vertical coordinate. Moving the origin cannot change the actual velocity.
Worked example 2: changing the displacement reference
Question. A graph now joins , with seconds and metres as before. Find each velocity and explain whether the horizontal stage represents rest.
Plan. Calculate differences, so that the common vertical shift cancels.
Why this step? Velocity depends on change in displacement, so adding the same constant to both endpoints leaves it unchanged.
Answer. The three velocities are unchanged. The particle rests from to , at displacement .
Check. Subtracting from all four vertical coordinates recovers the first graph, with identical segment gradients.
At a smooth turning point of displacement the velocity is zero. A reversal requires the velocity to change sign: a horizontal tangent alone does not establish that change. At a sharp corner of an idealised graph there is no single tangent; state the velocities on either side instead.
Watch out
Wrong: “The graph is above the time axis, so velocity is positive.” In the second example the final segment stays above the axis but has velocity . Right: the gradient gives velocity; the vertical coordinate gives displacement.
Change the duration of the final stage and check its new gradient.
Acceleration from a velocity graph
A velocity–time graph puts velocity on the vertical axis, so its gradient measures how velocity changes each second.
If velocity falls from to in , its change is and its acceleration is .
Velocity gradient
For a straight velocity–time segment,
For a curved graph, use the tangent gradient for instantaneous acceleration.
Not in the formula booklet: learn it.
A horizontal segment means zero acceleration. It represents rest only if its velocity is also zero. To decide whether speed increases, inspect both velocity and gradient: a line moving towards the time axis has decreasing speed, and one moving away has increasing speed.
Worked example 3: reversing with one acceleration
Question. A velocity graph joins , using seconds and . Find the acceleration on each stage, the reversal time, and whether speed increases at and .
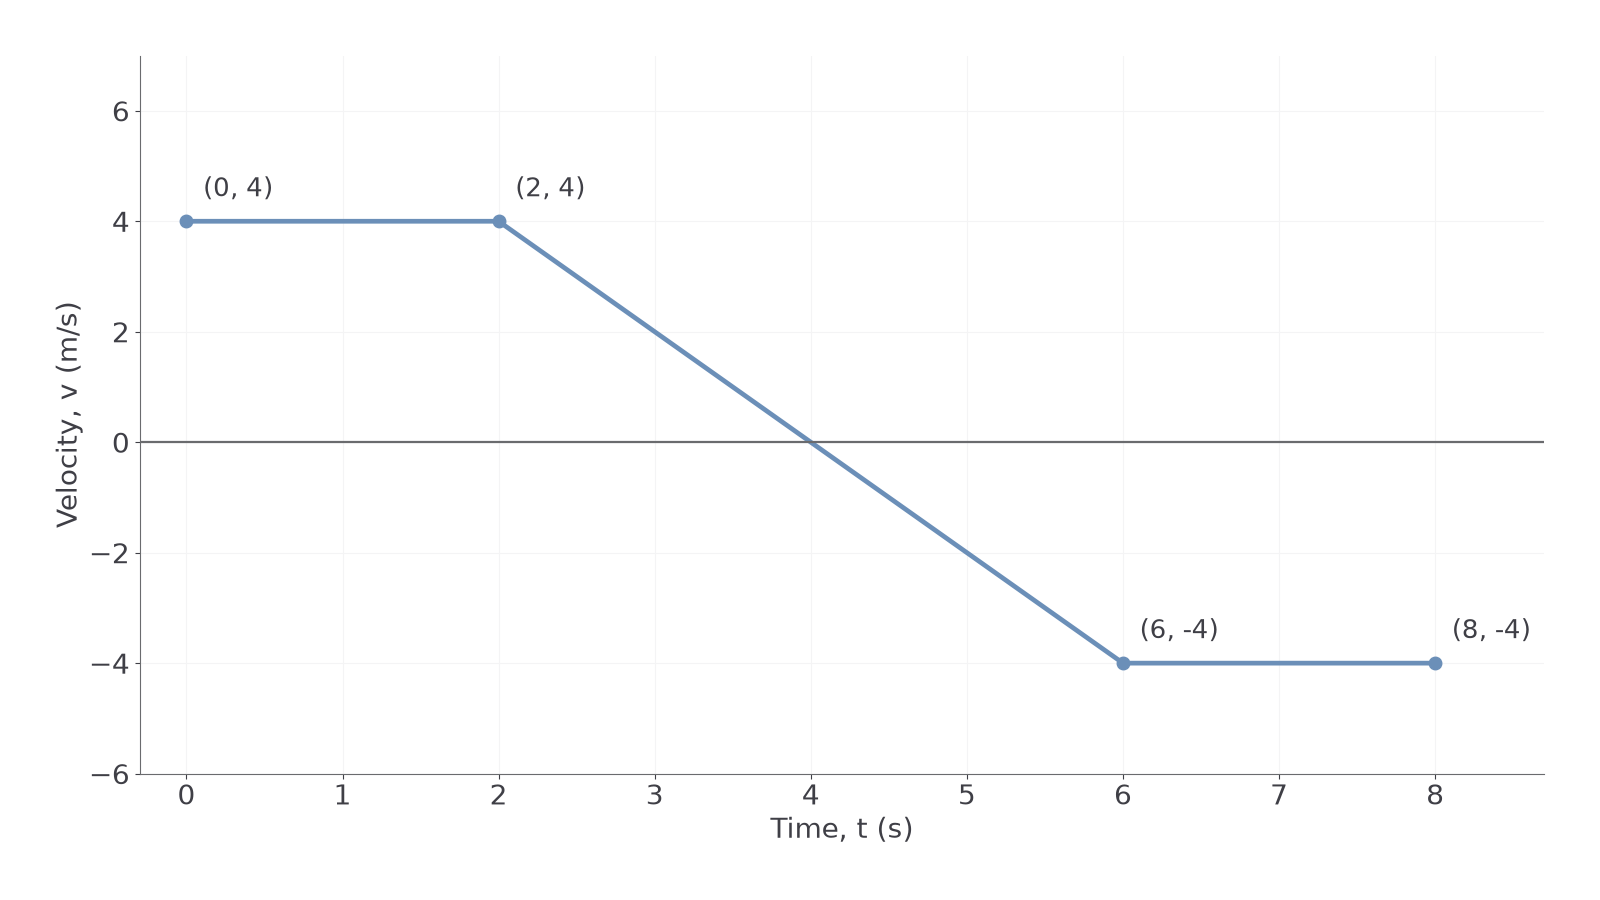
Plan. Find each gradient, locate zero velocity on the middle segment, then compare the signs of velocity and acceleration.
At , , so speed decreases. At , , so speed increases.
Why this step? The acceleration remains negative through the reversal; the change in the velocity's sign changes its effect on speed.
Answer. Accelerations are zero, , zero. The particle reverses at ; speed decreases at and increases at .
Check. Two seconds after the middle stage begins, velocity has changed by , reaching zero.
The second graph is shifted down by . Its gradient is unchanged, but its reversal occurs earlier.
Worked example 4: the same gradient with a different reversal
Question. A velocity graph joins by straight segments, using seconds and . Find the middle acceleration and reversal time, and describe the speed at and .
Plan. Use the middle gradient and subtract its constant velocity change from the velocity at .
Why this step? The elapsed time on the middle stage is , not ; its starting point is two seconds into the journey.
Answer. The acceleration is , with reversal at . Speed decreases at and increases at .
Check. At , , matching the final endpoint of the middle stage.
A curved velocity graph also gives acceleration from its steepness, rather than its height. Its maximum velocity need not occur at its maximum acceleration. At an idealised corner the acceleration can change abruptly; such a corner does not describe a perfectly smooth real transition.
Watch out
Wrong: “A horizontal velocity graph means the particle is stationary.” A horizontal line at means steady motion in the negative direction. Right: horizontal means ; rest requires .
Reverse the signs in the next situation and use the same sign comparison.
Displacement and distance from areas
Multiplying velocity by time gives a displacement, which is why area has a physical meaning on a velocity–time graph.
A rectangle at velocity for has area . A rectangle at velocity for the same time contributes of displacement, although its travelled distance is .
Areas and motion
Displacement is the signed area under a velocity–time graph. Total distance is the sum of the magnitudes of the areas, split wherever velocity changes sign.
Here and are the parallel sides of a trapezium. The area formulae and graph interpretation are recall results.
Not in the formula booklet: learn it.
A signed trapezium calculation can give displacement even when the line crosses the axis. It does not then give distance: split into positive area magnitudes at the crossing.
Continue this lesson.
You’re previewing NovaLearn without an account. Create a free account to read the rest.
Create free account