F6 - Linearising exponential and power data
Choose logarithmic axes that turn a power or exponential model into a straight line. Use its gradient and intercept to estimate the original constants, then check the model against data and the range of any prediction.
Power-law logarithmic axes
The outputs occur at inputs . Can a straight line reveal the relationship hiding in these curved data?
Doubling multiplies by , suggesting . Logging both coordinates turns that repeated multiplication into equal additions. Throughout, take logs of numerical measurements expressed in fixed stated units; do not mix units within a table.
You already know
A line has gradient and intercept . Also, for . These results are not in the formula booklet: learn them.
For , set , . Both and must be positive. A log–log plot puts the transformed output against the transformed input.
Straightening a power law
For and ,
If both logs are natural, and , while the gradient is still .
Not in the formula booklet: learn it.
On ordinary paper, calculate the logs and space their values uniformly. Logarithmic graph paper instead spaces the original labels by their logarithms. Either way, the horizontal mathematical coordinate is , not .
Worked example 1: recovering the opening model
Question. Use a log–log line to identify for the following exact data.
| , 4 d.p. | ||||
| , 4 d.p. |
Plan. Use well-separated transformed points for the gradient and the point with for the intercept.
Why this step? The intercept is the logarithm of the multiplier, so it needs back transformation before it can be used as .
Answer. .
Check. At , ; the model also gives the other three entries.
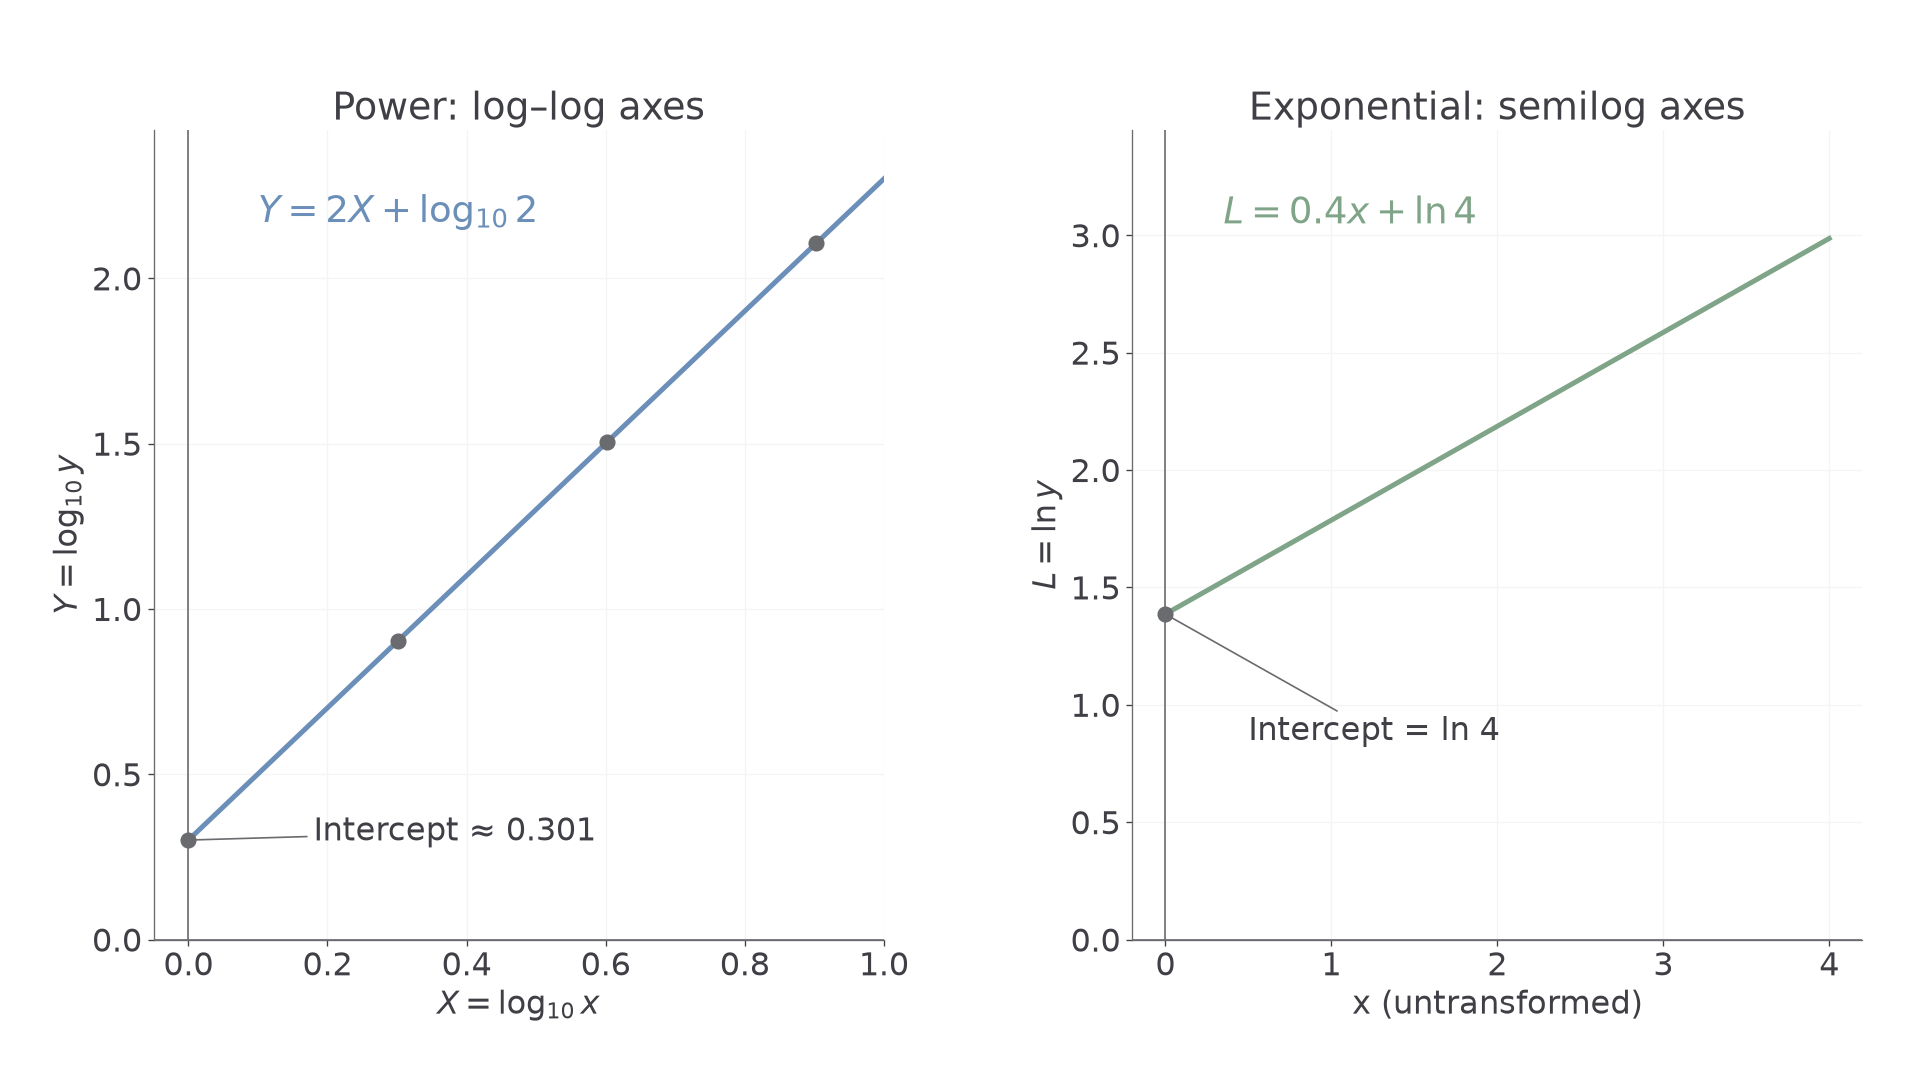
The left panel is the opening dataset. Now change only the power from to , keeping the multiplier . The transformed line's gradient reverses; its intercept stays fixed.
Worked example 2: a negative power
Question. A log–log fitted line passes through and . Find in and predict at .
Plan. Calculate the line's gradient, undo its intercept, then use the original model.
Why this step? The negative gradient is the exponent , not a negative multiplier; the original outputs remain positive.
Answer. , and at .
Check. At , and the model gives ; , the stated line point.
Changing units can move a log–log line without changing its gradient. In the opening model, replace by . Then : the exponent remains , while the multiplier changes from to . This follows from the unsupplied power-law transformation above, and is why a fitted exponent can survive a change of length units.
Watch out
Wrong: “The intercept is , so .” The intercept is , so . Only the gradient is read directly as a parameter of the power model.
Try another fitted line, changing the line data while keeping the same axes and recovery method.
Exponential semilogarithmic axes
An exponential model needs only its output logged: the original input already appears as the coefficient of a logarithm.
For example, gives , a straight line in . Logging as well would spoil that linear relationship.
Straightening an exponential model
For , with ,
With instead, , , so and .
Not in the formula booklet: learn it.
A semilog plot uses horizontally and vertically. It requires ; may be zero or negative. A positive gradient gives , a negative gradient gives , and zero gradient gives the constant model . These interpretation rules follow from the back transformation and are not supplied separately.
Worked example 3: a positive logged gradient
Question. A fitted line is . Find in , then predict at to three significant figures.
Plan. Exponentiate the intercept and gradient separately, and use their unrounded values for the prediction.
Why this step? The slope is , not . A base would describe decay, contradicting the positive slope.
Answer. , , and the prediction is .
Check. At , ; increasing by multiplies the model output by .
The right panel of the earlier diagram shows that line. Change only its gradient to . The original multiplier stays , but the exponential base becomes its reciprocal.
Continue this lesson.
You’re previewing NovaLearn without an account. Create a free account to read the rest.
Create free account