M2 - Conditional probability
Calculate probabilities after information restricts the possible outcomes. Use two-way tables, Venn diagrams and probability trees to identify the right conditioning population, including when a question reverses the information you were given.
Conditioning and tables
A production line makes of a factory's components. Must it also make most of the defective components? Not if its defect rate is sufficiently low. To answer, we need to be precise about which population a probability describes.
Start with a smaller table. Among trainees, attended training and of those passed. Once you are told the selected trainee attended training, only those people remain eligible. The probability of passing is , rather than .
You already know
An intersection describes both events occurring. For uniform selection from a finite population, an event's probability is its count divided by the eligible population count.
The information after the vertical bar determines that eligible population.
Conditional probability
is the probability of , given . Restrict attention to ; the successful part of this restricted population is .
Rescale the probability of to become the whole restricted population. Provided , this gives
The booklet supplies , with event names interchanged from its printed version. The conditional ratio is its rearrangement; it is not separately printed. Learn how to rearrange it and the positive-denominator condition. A zero numerator with a positive denominator gives probability zero; a zero denominator does not define this elementary conditional probability.
Worked example 1: conditioning on a table row
Question. One trainee is selected uniformly from this table. Find , where means trained and means passed.
| Passed | Did not pass | Total | |
|---|---|---|---|
| Trained | |||
| Not trained | |||
| Total |
Plan. Use the trained row as the denominator and its passed cell as the numerator.
Why this step? The condition tells us training has occurred; the untrained people do not enter this denominator.
Answer. .
Check. Of the trained row, the failing proportion is ; the two alternatives sum to .
Change only the condition from trained to not trained, keeping the same table and target event.
Worked example 2: conditioning on the other row
Question. For the same trainee table, with trained counts passed and failed, and untrained counts passed and failed, find .
Plan. Restrict to the untrained row.
Why this step? Changing the condition changes both the selected row and the relevant pass count.
Answer. .
Check. , reproducing the whole-table pass proportion .
Reversing the bar changes the population in a different way: , because now every passer is eligible. The shared numerator does not make the two conditional probabilities equal. The table shows association; it does not by itself establish that training caused the difference.
Watch out
Wrong: . That is the joint probability of trained and passed. The conditional denominator is , giving .
If and are independent and , the ratio gives . Conversely, that equality gives the product condition. This conditional independence test is not separately printed in the booklet: learn the reasoning. It is not valid to divide by a probability-zero condition.
Conditioning in Venn diagrams
A Venn diagram makes the restricted population visible. For , keep every region outside , including the region outside all circles. The numerator keeps only the portion also in .
With three events, fill the centre first. Pairwise totals include that centre unless the question explicitly says “only”. Subtract the centre from each pair total; then subtract the filled overlap regions from each whole-event total. The final outside count is the population total minus the union. This is a construction from event counts, rather than an extra booklet formula.
Worked example 3: constructing a three-event diagram
Question. Of people, run , swim and cycle . The inclusive pairwise totals are for , for and for . Exactly do all three. Construct the region counts and find for uniform selection.
Plan. Fill the triple region, then pair-only and single-only regions; restrict the probability to non-cyclists.
The interior total is , leaving outside.
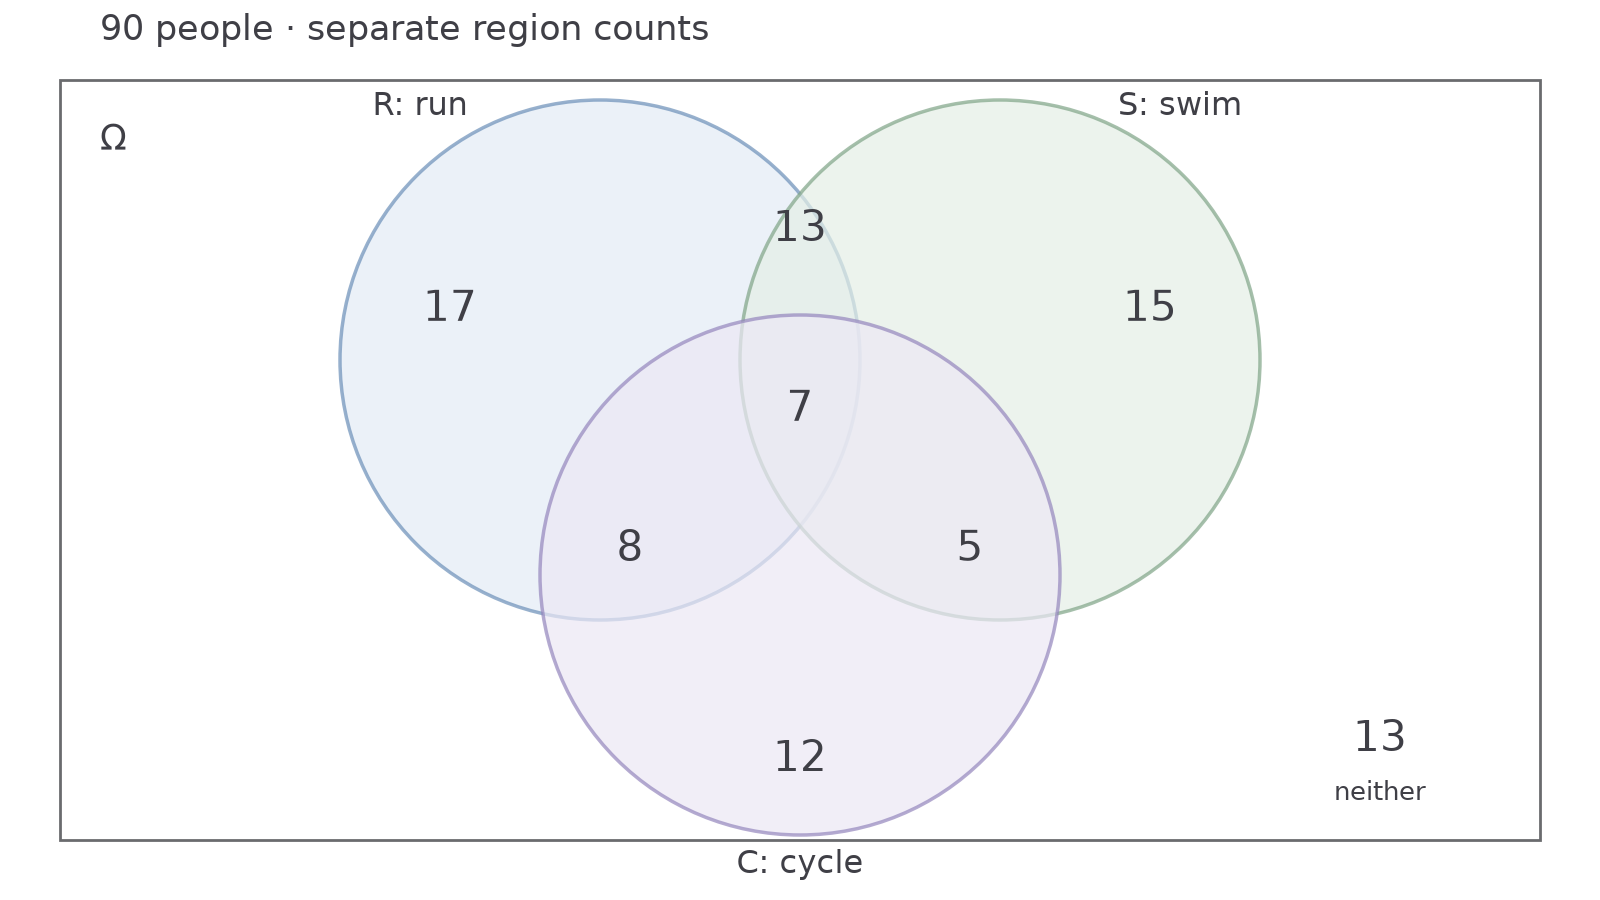
Why this step? Only the run-and-swim region outside is successful; all non-cyclists, including those outside every circle, are eligible.
Answer. The diagram shows the eight counts; the probability is .
Check. The non-cyclist regions sum to ; each whole circle recreates its given total.
Change just the condition from non-cyclist to cyclist. The same completed diagram now selects a different denominator and overlap.
Worked example 4: a different conditioning region
Question. In the same -person diagram, cycle and do all three activities. Find .
Plan. Keep the whole cyclist circle, then select its part that also lies in both other circles.
Why this step? The people in no longer satisfy the condition.
Answer. .
Check. The cyclist regions sum to , so the numerator is a subset of the denominator.
A union can also be the condition. Here , while . Thus . Add each eligible region once; an outcome in all three still counts once.
Watch out
Wrong: “Run-and-swim only is .” The given inclusive total contains the cyclists in the centre. Subtract them: the pair-only count is .
The same selection of regions works when the diagram is specified by probabilities instead of counts.
Continue this lesson.
You’re previewing NovaLearn without an account. Create a free account to read the rest.
Create free account