H4 - Integration as a limit of sums
Build area estimates from rectangle widths and heights, then see why their limiting value is a definite integral. Recognise an integral hidden in a sum and connect a finite numerical estimate with an exact antiderivative calculation.
Rectangle widths, heights and estimates
Can a collection of flat-topped rectangles recover the exact area under from to ? Four rectangles give different answers depending on which endpoint supplies each height. Neither answer is exact, but both tell us something useful.
You already know
A rectangle has area height times width. Sigma notation adds contributions: . The Fundamental Theorem evaluates exactly when an antiderivative is available. These are recall results, not supplied formulae.
Divide a fixed interval , with , into equal subintervals. Their common width is ; their widths must add to the full interval length.
Endpoint rectangle sums
A left-endpoint sum uses the height at the left end of every subinterval; a right-endpoint sum uses the right end. With ,
Both sums contain height-times-width contributions. The symbols and both mean a horizontal increment here. These rectangle-sum formulae are not in the formula booklet: learn the construction.
For an increasing function, each left height is below the graph across its strip, while each right height is above it. Hence . For a decreasing function the inequalities reverse. These are signed-integral comparisons; they describe ordinary area when .
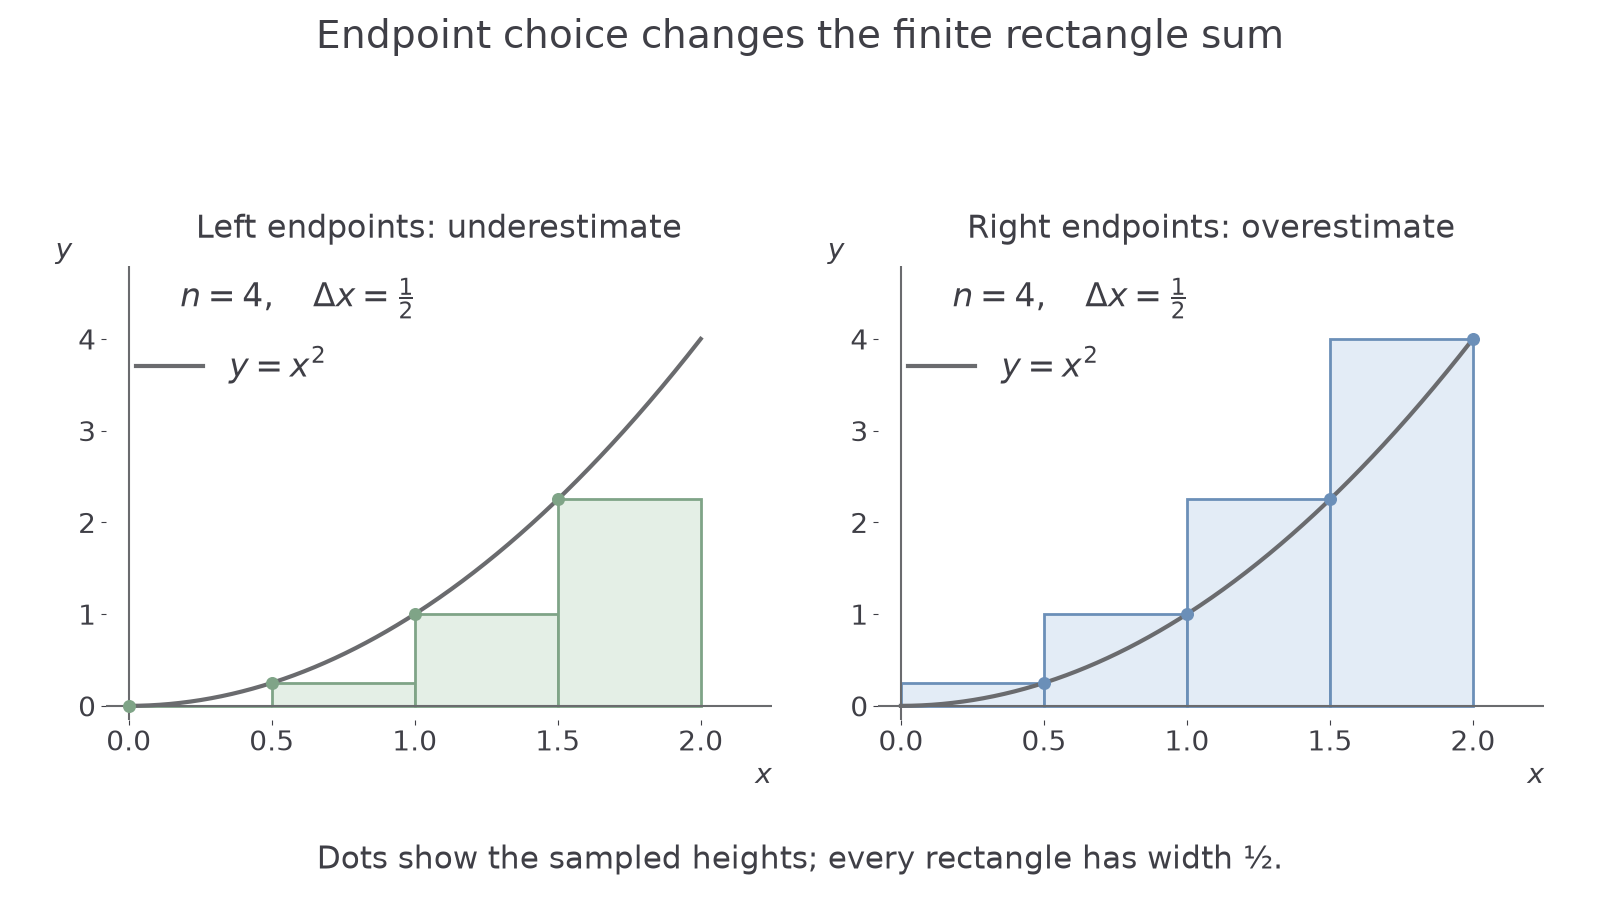
The picture uses four rectangles. Each height comes from a dot on the curve, while each rectangle still has a flat top.
Worked example 1: four rectangles
Question. Estimate the area under on using four equal rectangles, with left endpoints and with right endpoints.
Plan. Find the common width, square the appropriate endpoint positions and multiply their sum by the width.
Why this step? The squared values are heights, so the outside factor converts their sum into an area estimate.
Answer. Left estimate ; right estimate square units. They under- and overestimate respectively because increases here.
Check. The exact integral is , and .
Change only the number of rectangles from to . The interval stays fixed, so each width halves.
Worked example 2: eight rectangles
Question. Repeat the left- and right-endpoint estimates for on , using eight equal rectangles.
Plan. Use width and endpoint heights .
Why this step? Each contribution is ; the width is an additional factor, separate from the height's square.
Answer. Left estimate ; right estimate square units.
Check. . The gap is , compared with for four rectangles.
Whether an endpoint estimate is above or below depends on the graph's direction of change. For the decreasing graph on , four left heights are ; their estimate is , above the exact area .
Watch out
Wrong: for the first example. This adds heights only. Right: multiply by the width , giving square units.
Now change the number of rectangles again. The same increasing graph still determines the direction of each error.
The limiting sum and the integral
Increasing the number of rectangles makes each width smaller while they still cover the whole fixed interval. We do not set the width to zero and add zero areas; we examine the value approached by the complete sum.
For a continuous function, nearby heights become close as their horizontal separation shrinks. On a fixed closed interval this controls all the strips: choosing different points within the shrinking strips does not change the limiting sum. Such height-times-width sums are called Riemann sums.
Integration as a limiting sum
For continuous on ,
Left endpoints, or any sample point in each subinterval, give the same limit as the widths tend to zero. Negative heights give negative contributions: this is a signed integral. For total geometric area, use as the heights.
Not in the formula booklet: learn it.
For an increasing function, the upper and lower bounds make convergence especially visible. Subtracting the endpoint sums cancels all shared interior heights:
The endpoint values stay fixed while , so this gap tends to zero. The integral is trapped between the sums, forcing both towards it. This gap result is not in the formula booklet: derive it by cancellation.
Continue this lesson.
You’re previewing NovaLearn without an account. Create a free account to read the rest.
Create free account