L1 - Data displays and histograms
Read a display by asking what its positions, heights and areas represent. You will interpret histograms, boxplots and cumulative frequency graphs, compare distributions and turn recorded frequencies into proportions.
Choosing a display for one variable
Can the tallest histogram bar contain fewer cars than a shorter bar? It can: a narrow interval may have a high concentration of cars but a smaller total count. Choosing the display and reading its scale come before comparing its shapes.
You already know
A frequency counts observations. A proportion is a count divided by the total count. A rectangle's area is width multiplied by height.
A car's make is a category; its mass is a numerical measurement. The AQA workbook's fuel-type numbers are category codes, so the difference between two codes is not a measured difference in fuel. ReferenceNumber is an identifier, not a numerical characteristic to average.
Single-variable data
Single-variable data record one characteristic for each observation. A bar chart uses separate bars for categories; a histogram groups a numerical variable into intervals whose widths have meaning.
Match a display to the question you want to answer. This is a choice of information, not a rule that one display is always best.
| Question | Useful display | Information it exposes |
|---|---|---|
| Which car make occurs most often? | Bar chart | Counts for separate categories |
| Where are masses concentrated? | Histogram | Shape, intervals and tails |
| Which service has shorter, more consistent waits? | Boxplots on one scale | Median and quartile spread |
| How many journeys take at most a stated time? | Cumulative frequency graph | Count up to a threshold |
The current AQA car workbook has selected records: BMW , FORD , TOYOTA , VAUXHALL and VOLKSWAGEN . These counts add to the workbook total. They describe its restricted selection of makes, registration weeks and keeper regions, rather than national market shares. The workbook is a Department for Transport database extract, containing selected cars from and .
A boxplot can hide two clusters with similar quartiles. A histogram shows more shape, but changing its class boundaries can change that appearance. A long tail towards high values indicates positive skew; a long tail towards low values indicates negative skew. Look towards the tail rather than the tallest bar. These shape descriptions are not in the formula booklet: learn them. Read labels, units, class boundaries, key and total count before interpreting either. An unfamiliar display is manageable once you identify what one point or symbol represents.
Key idea
Choose a display using the variable type and the question; then identify the group and scale that its values actually describe.
A categorical code can look numerical while still being only a label. Use that distinction here.
Histogram density and area
A histogram spreads each class frequency over its interval, so height measures concentration and area measures count.
These illustrative waiting-time classes contain a total of waits. The last column gives the heights of their histogram bars.
| Waiting time in minutes | Frequency | Width | Frequency density |
|---|---|---|---|
The tallest bar contains waits, while the lower but wider next bar contains .
Frequency density
Use the actual measurement boundaries. For , the width is .
Not in the formula booklet: learn it.
For measurements rounded to whole units, a printed class such as – may instead have boundaries and . Use the stated recording convention. With true density on the axis, rectangle area equals frequency; with an axis merely proportional to density, first determine its common scale factor from a known class. For example, if an area of grid squares represents observations, each square represents . An area of such squares then represents observations. These are area units, rather than vertical-axis readings.
Worked example 1: read a whole class
Question. Using the waiting-time class data above, find the frequency in and the proportion of all waits in that class.
Plan. Multiply width by height, then divide the class count by the total.
Why this step? Height alone describes waits per minute of interval, not the number of waits.
Answer. There are waits, giving proportion .
Check. The four areas sum to .
Now change only the requested interval: its upper boundary lies inside the same class. The raw observations' positions are unknown, so the resulting count is an estimate.
Worked example 2: use part of a bar
Question. Use those class data to estimate how many of the waits satisfy , and their proportion. State the assumption.
Plan. Use the area over the shorter interval, assuming a uniform spread within its class.
Why this step? The constant bar height allocates the same estimated count to each minute of the class; the original grouped data do not prove that allocation.
Answer. An estimated waits, proportion , assuming observations are uniformly distributed within .
Check. The interval covers of the class width, and .
The authentic AQA mass histogram below excludes the impossible zero masses, leaving positive masses. Mass is recorded in , including for an average driver. Its class frequencies are , with the boundaries shown.
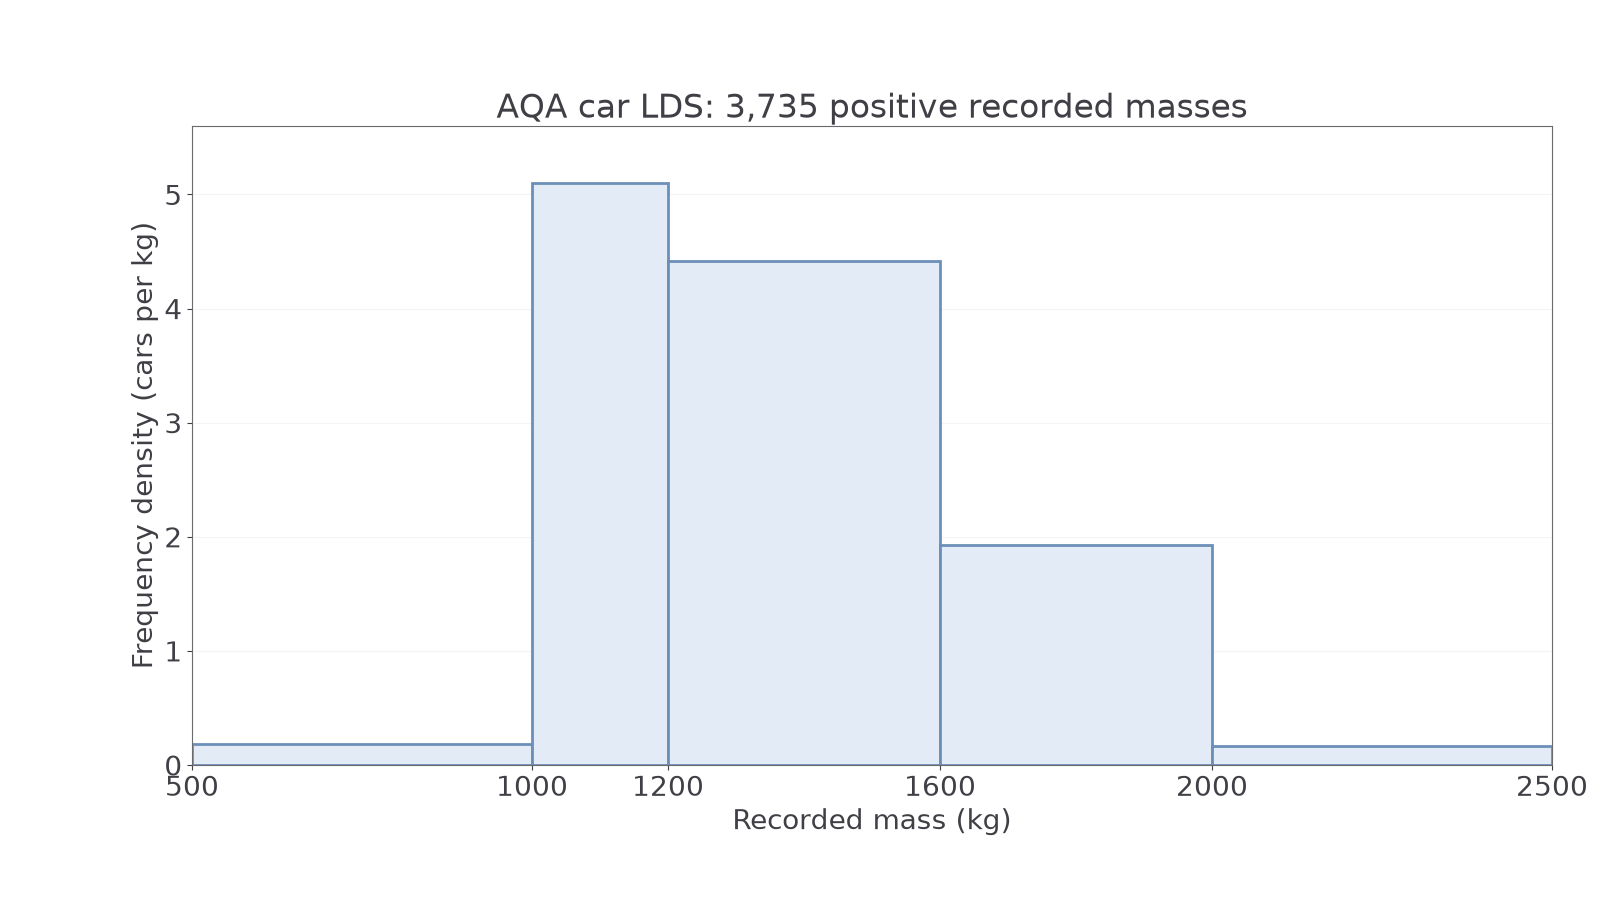
The – bar has height cars per . The – bar is taller, at , but contains fewer cars. That answers the opening question with real data.
Source: AQA car LDS, DfT Stock Vehicle Database; public sector information under Open Government Licence v3.0. The exclusion applies to this mass analysis.
Watch out
Wrong: “The bar of height contains more cars than the bar of height .” Unequal widths make heights incomparable as counts. Right: compare areas and .
For the next partial-bar estimate, identify both the interval width and the total number of observations from the question itself.
Continue this lesson.
You’re previewing NovaLearn without an account. Create a free account to read the rest.
Create free account